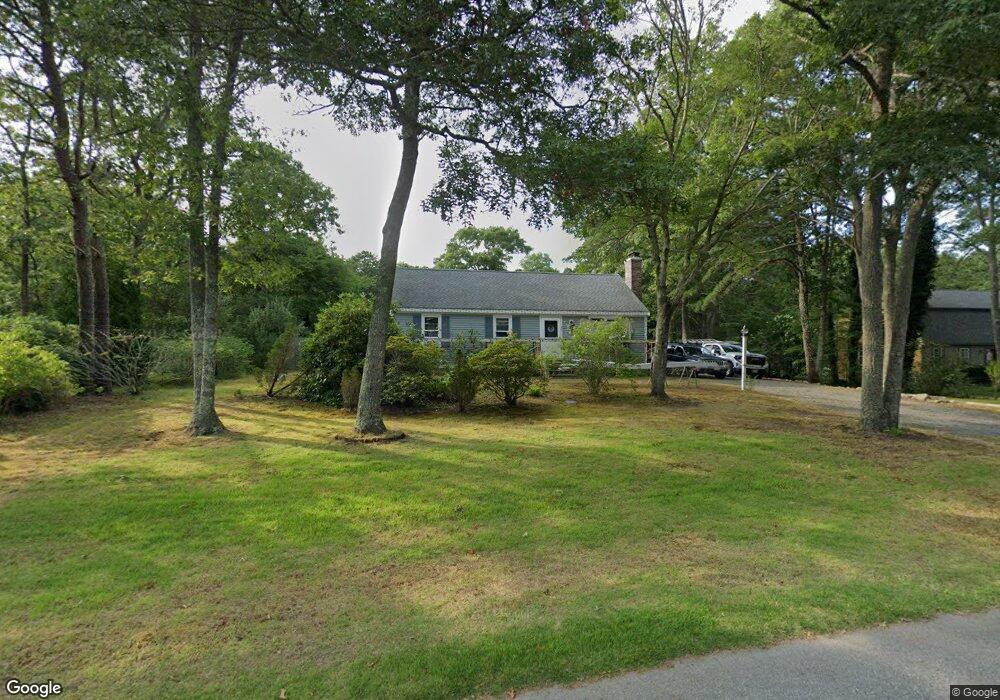
35 Saddleback Rd Mashpee, MA 02649
Estimated Value: $475,000 - $599,000
3
Beds
1
Bath
1,040
Sq Ft
$522/Sq Ft
Est. Value
About This Home
This home is located at 35 Saddleback Rd, Mashpee, MA 02649 and is currently estimated at $542,580, approximately $521 per square foot. 35 Saddleback Rd is a home located in Barnstable County with nearby schools including Kenneth C. Coombs School, Quashnet School, and Mashpee Middle School.
Ownership History
Date
Name
Owned For
Owner Type
Purchase Details
Closed on
May 16, 2008
Sold by
Wells Fargo Bk
Bought by
Lindh James M and Lindh Julie A
Current Estimated Value
Home Financials for this Owner
Home Financials are based on the most recent Mortgage that was taken out on this home.
Original Mortgage
$194,750
Outstanding Balance
$123,528
Interest Rate
5.91%
Mortgage Type
Purchase Money Mortgage
Estimated Equity
$419,052
Purchase Details
Closed on
May 3, 2005
Sold by
Carloni Achille G and Carloni Peter J
Bought by
Anderson Jeffery R and Anderson Zona M
Home Financials for this Owner
Home Financials are based on the most recent Mortgage that was taken out on this home.
Original Mortgage
$244,800
Interest Rate
5.95%
Mortgage Type
Purchase Money Mortgage
Purchase Details
Closed on
Jun 19, 1989
Sold by
Windsor Devt Corp
Bought by
Carloni Achille G
Home Financials for this Owner
Home Financials are based on the most recent Mortgage that was taken out on this home.
Original Mortgage
$80,000
Interest Rate
10.87%
Mortgage Type
Purchase Money Mortgage
Create a Home Valuation Report for This Property
The Home Valuation Report is an in-depth analysis detailing your home's value as well as a comparison with similar homes in the area
Purchase History
| Date | Buyer | Sale Price | Title Company |
|---|---|---|---|
| Lindh James M | $205,000 | -- | |
| Anderson Jeffery R | $306,000 | -- | |
| Carloni Achille G | $119,900 | -- |
Source: Public Records
Mortgage History
| Date | Status | Borrower | Loan Amount |
|---|---|---|---|
| Open | Lindh James M | $194,750 | |
| Previous Owner | Anderson Jeffery R | $244,800 | |
| Previous Owner | Carloni Achille G | $80,000 |
Source: Public Records
Tax History
| Year | Tax Paid | Tax Assessment Tax Assessment Total Assessment is a certain percentage of the fair market value that is determined by local assessors to be the total taxable value of land and additions on the property. | Land | Improvement |
|---|---|---|---|---|
| 2025 | $3,017 | $455,700 | $207,000 | $248,700 |
| 2024 | $2,734 | $425,200 | $188,200 | $237,000 |
| 2023 | $2,618 | $373,500 | $179,200 | $194,300 |
| 2022 | $2,486 | $304,300 | $145,700 | $158,600 |
| 2021 | $2,375 | $261,800 | $131,200 | $130,600 |
| 2020 | $2,305 | $253,600 | $126,200 | $127,400 |
| 2019 | $2,211 | $244,300 | $126,200 | $118,100 |
| 2018 | $7,257 | $223,200 | $126,200 | $97,000 |
| 2017 | $1,968 | $214,100 | $126,200 | $87,900 |
| 2016 | $1,920 | $207,800 | $126,200 | $81,600 |
| 2015 | $1,852 | $203,300 | $126,200 | $77,100 |
| 2014 | $1,893 | $201,600 | $124,600 | $77,000 |
Source: Public Records
Map
Nearby Homes
- 94 Lowell Rd
- 35 Ashumet Rd Unit 14A
- 35 Ashumet Rd Unit 14A
- 86 Lowell Rd
- 26 Country Club Ln
- 22 Country Club Ln
- 1 Par Three Ct Unit 1
- 8 Chippers Ln
- 8 Chippers Ln Unit 390
- 18 Executive Dr Unit 18
- 80 Pine Hill Blvd Unit 80
- 18 Windward St Unit 18
- 4 N Ridge Rd
- 4 N Ridge Rd Unit 431
- 1 Upland Cir
- 1 Upland Cir Unit 1
- 1 Masters Ct
- 6 Masters Ct
- 153 Leisure Green Dr
- 153 Leisure Green Dr Unit 749
- 31 Saddleback Rd
- 39 Saddleback Rd
- 38 Saddleback Rd
- 43 Saddleback Rd
- 29 Saddleback Rd
- 30 Saddleback Rd
- 42 Saddleback Rd
- 47 Saddleback Rd
- 27 Saddleback Rd
- 46 Saddleback Rd
- 26 Saddleback Rd
- 0 Saddleback Rd
- 51 Saddleback Rd
- 50 Saddleback Rd
- 22 Saddleback Rd
- 23 Saddleback Rd
- 54 Saddleback Rd
- 55 Saddleback Rd
- 18 Saddleback Rd
- 19 Saddleback Rd
Your Personal Tour Guide
Ask me questions while you tour the home.