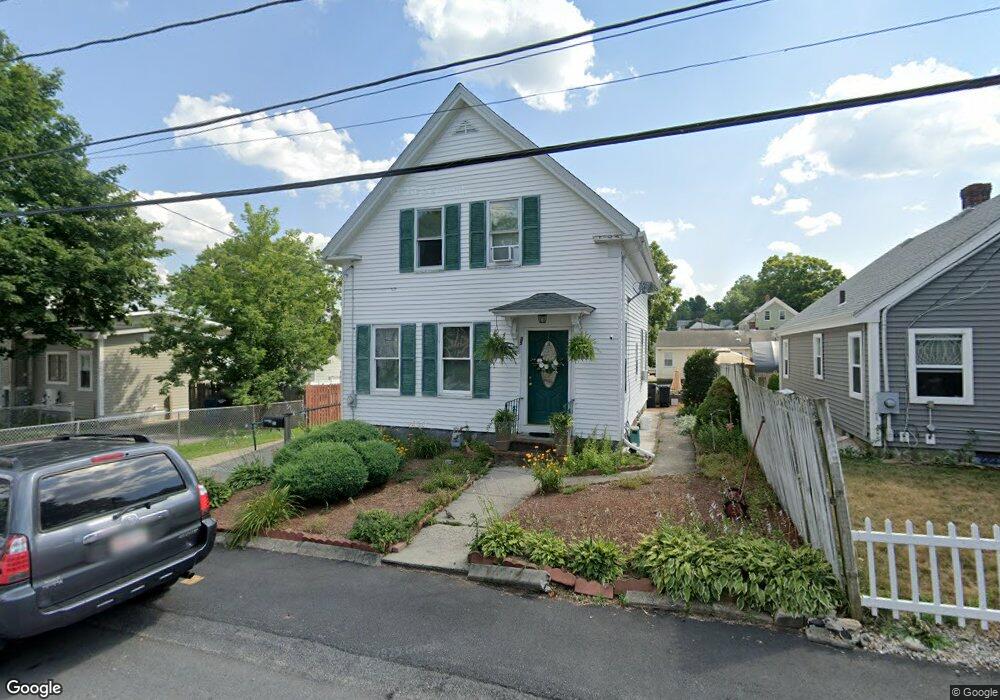
35 Spring St Milford, MA 01757
Estimated Value: $429,682 - $465,000
3
Beds
2
Baths
1,629
Sq Ft
$275/Sq Ft
Est. Value
About This Home
This home is located at 35 Spring St, Milford, MA 01757 and is currently estimated at $447,421, approximately $274 per square foot. 35 Spring St is a home located in Worcester County with nearby schools including Milford High School and Bethany Christian Academy.
Ownership History
Date
Name
Owned For
Owner Type
Purchase Details
Closed on
Jan 26, 2004
Sold by
Smith Ft and Smith Carol
Bought by
Franco Jose A and Franco Maria
Current Estimated Value
Home Financials for this Owner
Home Financials are based on the most recent Mortgage that was taken out on this home.
Original Mortgage
$159,200
Outstanding Balance
$74,975
Interest Rate
5.89%
Mortgage Type
Purchase Money Mortgage
Estimated Equity
$372,446
Purchase Details
Closed on
Jun 19, 1997
Sold by
Kelley Robert V
Bought by
Smith Sidney
Create a Home Valuation Report for This Property
The Home Valuation Report is an in-depth analysis detailing your home's value as well as a comparison with similar homes in the area
Home Values in the Area
Average Home Value in this Area
Purchase History
| Date | Buyer | Sale Price | Title Company |
|---|---|---|---|
| Franco Jose A | $199,000 | -- | |
| Smith Sidney | $40,000 | -- |
Source: Public Records
Mortgage History
| Date | Status | Borrower | Loan Amount |
|---|---|---|---|
| Open | Franco Jose A | $159,200 |
Source: Public Records
Tax History
| Year | Tax Paid | Tax Assessment Tax Assessment Total Assessment is a certain percentage of the fair market value that is determined by local assessors to be the total taxable value of land and additions on the property. | Land | Improvement |
|---|---|---|---|---|
| 2025 | $4,932 | $385,300 | $148,800 | $236,500 |
| 2024 | $4,678 | $352,000 | $141,900 | $210,100 |
| 2023 | $4,552 | $315,000 | $119,400 | $195,600 |
| 2022 | $4,318 | $280,600 | $109,000 | $171,600 |
| 2021 | $3,981 | $249,100 | $109,000 | $140,100 |
| 2020 | $3,934 | $246,500 | $109,000 | $137,500 |
| 2019 | $3,561 | $215,300 | $109,000 | $106,300 |
| 2018 | $3,479 | $210,100 | $103,800 | $106,300 |
| 2017 | $3,272 | $194,900 | $103,800 | $91,100 |
| 2016 | $3,055 | $177,800 | $93,400 | $84,400 |
| 2015 | $3,106 | $177,000 | $90,000 | $87,000 |
Source: Public Records
Map
Nearby Homes
- 56 S Bow St
- 4-6 State St
- 9 Granite St
- 67 Pine St
- 6 Poplar St
- 33 Chestnut St
- 40 Chestnut St
- 6 Jen Paul Way Unit B
- 14 Emmons St
- 46 Bancroft Ave
- 56 S Main St
- 99-101 E Main St
- 40 Oliver St
- 35 Woodland Ave Unit 35A
- 14 Lawrence St
- 47 W Walnut St
- 3 Columbus Ave
- 7 Woodland Ct Unit B
- 9 Ariana Cir Unit 9
- 2 Lee St Unit B
- 44 Court St
- 52 Jefferson St
- 52 Jefferson St Unit 1
- 63 N Bow St
- 54 Jefferson St
- 32 Spring St
- 30 Spring St
- 30 Spring St Unit 1
- 36 Spring St
- 38 Spring St
- 56 Jefferson St
- 40 Court St Unit 42
- 40 Court St Unit A
- 23 Spring St
- 53 N Bow St
- 53 N Bow St Unit 2
- 26 Spring St Unit 28
- 42 Court St Unit 42
- 42 Court St Unit B
- 42 Court St
Your Personal Tour Guide
Ask me questions while you tour the home.