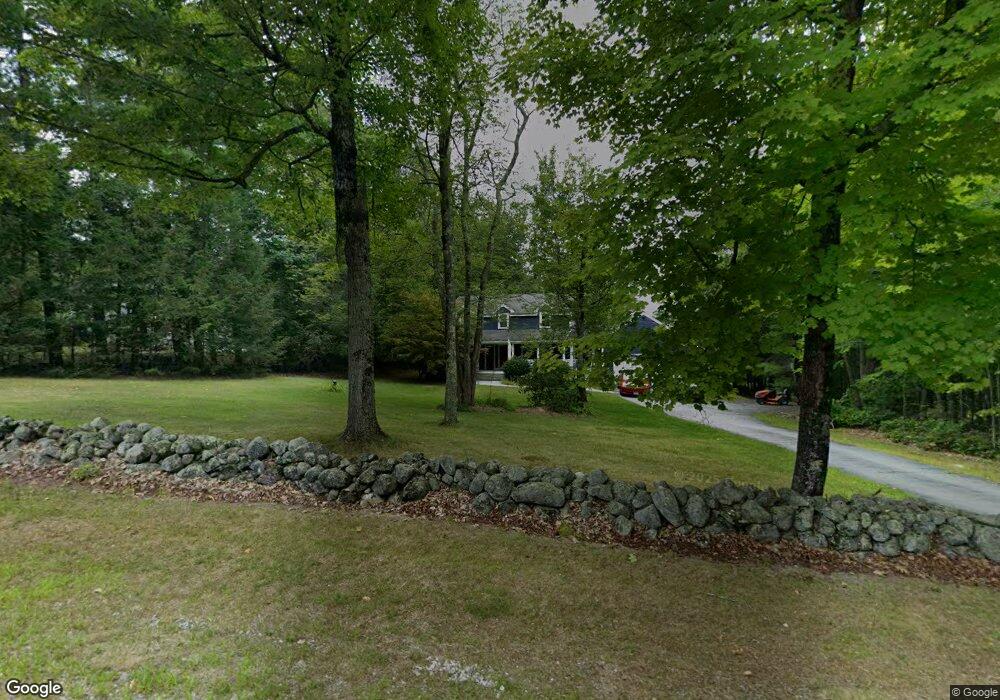
35 W Hill Rd Brookline, NH 03033
Estimated Value: $654,133 - $826,000
3
Beds
3
Baths
2,035
Sq Ft
$350/Sq Ft
Est. Value
About This Home
This home is located at 35 W Hill Rd, Brookline, NH 03033 and is currently estimated at $712,283, approximately $350 per square foot. 35 W Hill Rd is a home located in Hillsborough County with nearby schools including Richard Maghakian Memorial School, Captain Samuel Douglass Academy, and Hollis-Brookline Middle School.
Ownership History
Date
Name
Owned For
Owner Type
Purchase Details
Closed on
Jun 15, 2017
Sold by
Nedelman Ft and Nedelman Gary M
Bought by
Andrews Mark E and Andrews Hillary
Current Estimated Value
Home Financials for this Owner
Home Financials are based on the most recent Mortgage that was taken out on this home.
Original Mortgage
$485,277
Outstanding Balance
$403,649
Interest Rate
4.02%
Mortgage Type
VA
Estimated Equity
$308,634
Create a Home Valuation Report for This Property
The Home Valuation Report is an in-depth analysis detailing your home's value as well as a comparison with similar homes in the area
Home Values in the Area
Average Home Value in this Area
Purchase History
| Date | Buyer | Sale Price | Title Company |
|---|---|---|---|
| Andrews Mark E | $485,000 | -- |
Source: Public Records
Mortgage History
| Date | Status | Borrower | Loan Amount |
|---|---|---|---|
| Open | Andrews Mark E | $485,277 |
Source: Public Records
Tax History Compared to Growth
Tax History
| Year | Tax Paid | Tax Assessment Tax Assessment Total Assessment is a certain percentage of the fair market value that is determined by local assessors to be the total taxable value of land and additions on the property. | Land | Improvement |
|---|---|---|---|---|
| 2024 | $12,924 | $571,600 | $211,400 | $360,200 |
| 2023 | $11,878 | $571,600 | $211,400 | $360,200 |
| 2022 | $10,762 | $362,100 | $133,600 | $228,500 |
| 2021 | $10,349 | $362,100 | $133,600 | $228,500 |
| 2020 | $10,066 | $362,100 | $133,600 | $228,500 |
| 2019 | $10,816 | $362,100 | $133,600 | $228,500 |
| 2018 | $10,704 | $362,100 | $133,600 | $228,500 |
| 2017 | $9,829 | $298,400 | $108,000 | $190,400 |
| 2016 | $9,218 | $283,100 | $108,000 | $175,100 |
| 2015 | $8,790 | $283,100 | $108,000 | $175,100 |
| 2014 | $9,300 | $283,100 | $108,000 | $175,100 |
| 2013 | $8,954 | $283,100 | $108,000 | $175,100 |
Source: Public Records
Map
Nearby Homes
- 9 Winterberry Rd
- 7 Winterberry Rd
- 1235 Townsend Rd
- 15 N End Rd
- 0 Brookline St
- 364 Townsend Hill Rd
- 64 Meadow Rd
- 11 Fox Run
- 18 Bridle Path
- 10 Stearns Ave
- 75 Highland St
- 91 Highland St
- 55 Oak Hill Rd
- 46 Oak Hill Rd
- 1275 Valley Rd
- 6 High Oaks Path
- 1 Depot Street Extension Unit 2
- 1 Depot Street Extension Unit 5
- 1 Depot Street Extension Unit 3
- 1 Depot Street Extension Unit 4