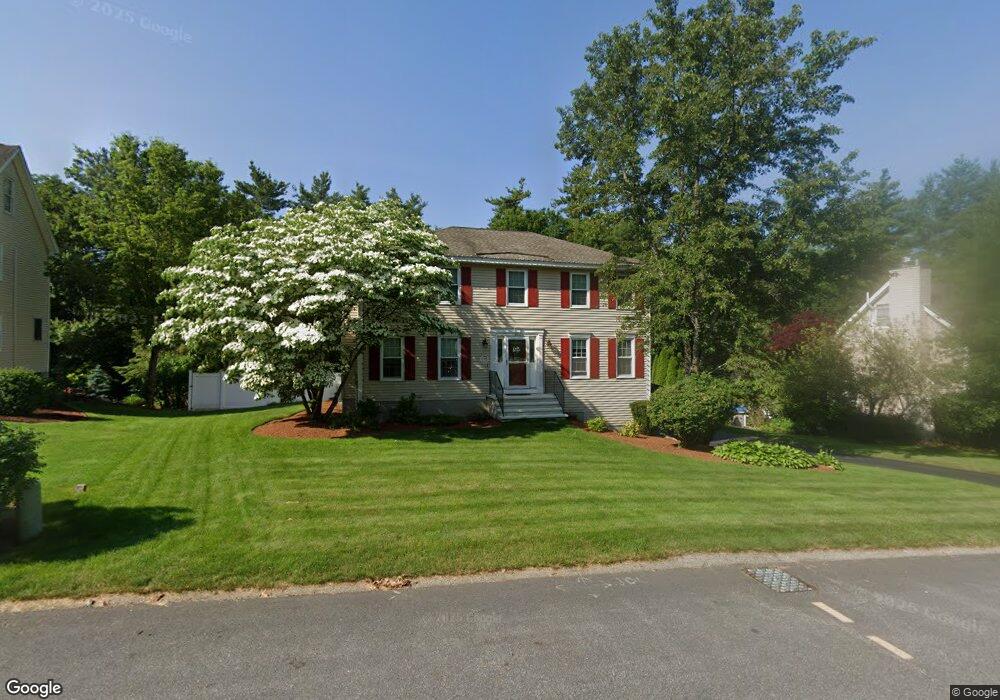
35 Windover Ln MerriMacK, NH 03054
Estimated Value: $672,566 - $765,000
4
Beds
3
Baths
1,976
Sq Ft
$362/Sq Ft
Est. Value
About This Home
This home is located at 35 Windover Ln, MerriMacK, NH 03054 and is currently estimated at $715,892, approximately $362 per square foot. 35 Windover Ln is a home located in Hillsborough County with nearby schools including Reeds Ferry School, James Mastricola Upper Elementary School, and Merrimack Middle School.
Ownership History
Date
Name
Owned For
Owner Type
Purchase Details
Closed on
Feb 5, 2020
Sold by
Francoeur Mark J and Francoeur Tracey A
Bought by
Francoeur Ft
Current Estimated Value
Purchase Details
Closed on
Jul 19, 2004
Sold by
Sthilaire Mark R and Sthilaire Jennifer L
Bought by
Francoeur Mark J
Home Financials for this Owner
Home Financials are based on the most recent Mortgage that was taken out on this home.
Original Mortgage
$230,000
Interest Rate
6.25%
Mortgage Type
Purchase Money Mortgage
Purchase Details
Closed on
Apr 1, 1998
Sold by
Amico Robert J and Amico Beverly M
Bought by
St Hilaire Mark R and St Hilaire Jennifer L
Home Financials for this Owner
Home Financials are based on the most recent Mortgage that was taken out on this home.
Original Mortgage
$155,800
Interest Rate
6.89%
Create a Home Valuation Report for This Property
The Home Valuation Report is an in-depth analysis detailing your home's value as well as a comparison with similar homes in the area
Home Values in the Area
Average Home Value in this Area
Purchase History
| Date | Buyer | Sale Price | Title Company |
|---|---|---|---|
| Francoeur Ft | -- | None Available | |
| Francoeur Mark J | $360,000 | -- | |
| St Hilaire Mark R | $164,000 | -- |
Source: Public Records
Mortgage History
| Date | Status | Borrower | Loan Amount |
|---|---|---|---|
| Previous Owner | St Hilaire Mark R | $225,000 | |
| Previous Owner | St Hilaire Mark R | $243,500 | |
| Previous Owner | St Hilaire Mark R | $230,000 | |
| Previous Owner | St Hilaire Mark R | $155,800 |
Source: Public Records
Tax History Compared to Growth
Tax History
| Year | Tax Paid | Tax Assessment Tax Assessment Total Assessment is a certain percentage of the fair market value that is determined by local assessors to be the total taxable value of land and additions on the property. | Land | Improvement |
|---|---|---|---|---|
| 2024 | $10,628 | $513,700 | $203,000 | $310,700 |
| 2023 | $9,991 | $513,700 | $203,000 | $310,700 |
| 2022 | $8,928 | $513,700 | $203,000 | $310,700 |
| 2021 | $8,820 | $513,700 | $203,000 | $310,700 |
| 2020 | $8,279 | $344,100 | $147,400 | $196,700 |
| 2019 | $8,303 | $344,100 | $147,400 | $196,700 |
| 2018 | $8,300 | $344,100 | $147,400 | $196,700 |
| 2017 | $8,042 | $344,100 | $147,400 | $196,700 |
| 2016 | $7,528 | $330,300 | $147,400 | $182,900 |
| 2015 | $7,035 | $284,600 | $124,000 | $160,600 |
| 2014 | $6,781 | $281,500 | $124,000 | $157,500 |
| 2013 | $6,731 | $281,500 | $124,000 | $157,500 |
Source: Public Records
Map
Nearby Homes
- 5 Barbie Ct
- 18 Horizon Dr
- 29 Bedford Rd
- 16 Summit Rd
- 56 Greenfield Pkwy
- 38 Mallard Point
- 22 Kimberly Dr
- 19 Vista Way
- 8 Donovan Ct
- 1 Pleasant St
- 10 Barrington Dr
- 40 Seton Dr
- 10 Kingston Ct Unit 10
- 22 Essex Green Ct
- 11 Essex Green Ct
- 12 Clinton Ct
- 22 Clay St
- 197 Liberty Hill Rd
- 9 Mustang Dr Unit C
- 9 Mustang Dr Unit B