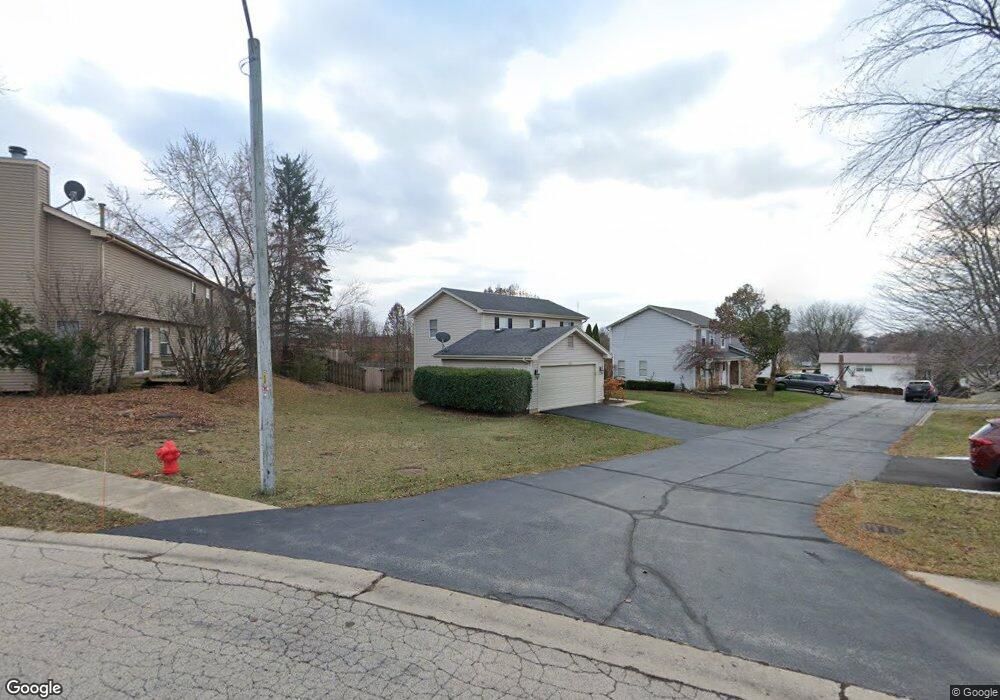
350 Country Ln Algonquin, IL 60102
High Hill Farms NeighborhoodEstimated Value: $325,552 - $392,000
3
Beds
2
Baths
1,496
Sq Ft
$239/Sq Ft
Est. Value
About This Home
This home is located at 350 Country Ln, Algonquin, IL 60102 and is currently estimated at $357,888, approximately $239 per square foot. 350 Country Ln is a home located in McHenry County with nearby schools including Westfield Community School, Kenneth E Neubert Elementary School, and Harry D Jacobs High School.
Ownership History
Date
Name
Owned For
Owner Type
Purchase Details
Closed on
Aug 9, 2005
Sold by
Swiersz Arthur H and Swiersz Angela R
Bought by
Schneider Riley Lee A
Current Estimated Value
Home Financials for this Owner
Home Financials are based on the most recent Mortgage that was taken out on this home.
Original Mortgage
$170,000
Outstanding Balance
$90,220
Interest Rate
5.82%
Mortgage Type
Fannie Mae Freddie Mac
Estimated Equity
$267,668
Purchase Details
Closed on
Jun 13, 2001
Sold by
Sanchez Frank R and Sanchez Caryn A
Bought by
Swiersz Arthur H and Swiersz Angela R
Home Financials for this Owner
Home Financials are based on the most recent Mortgage that was taken out on this home.
Original Mortgage
$142,590
Interest Rate
7.16%
Create a Home Valuation Report for This Property
The Home Valuation Report is an in-depth analysis detailing your home's value as well as a comparison with similar homes in the area
Home Values in the Area
Average Home Value in this Area
Purchase History
| Date | Buyer | Sale Price | Title Company |
|---|---|---|---|
| Schneider Riley Lee A | $213,000 | Stewart Title Guaranty Compa | |
| Swiersz Arthur H | $147,000 | Universal Title Services Inc |
Source: Public Records
Mortgage History
| Date | Status | Borrower | Loan Amount |
|---|---|---|---|
| Open | Schneider Riley Lee A | $170,000 | |
| Previous Owner | Swiersz Arthur H | $142,590 |
Source: Public Records
Tax History
| Year | Tax Paid | Tax Assessment Tax Assessment Total Assessment is a certain percentage of the fair market value that is determined by local assessors to be the total taxable value of land and additions on the property. | Land | Improvement |
|---|---|---|---|---|
| 2024 | $6,380 | $97,555 | $24,738 | $72,817 |
| 2023 | $6,634 | $87,251 | $22,125 | $65,126 |
| 2022 | $5,648 | $71,856 | $21,044 | $50,812 |
| 2021 | $5,408 | $66,942 | $19,605 | $47,337 |
| 2020 | $5,259 | $64,572 | $18,911 | $45,661 |
| 2019 | $5,124 | $61,803 | $18,100 | $43,703 |
| 2018 | $4,870 | $57,093 | $16,721 | $40,372 |
| 2017 | $4,758 | $53,785 | $15,752 | $38,033 |
| 2016 | $4,674 | $50,446 | $14,774 | $35,672 |
| 2013 | -- | $47,732 | $13,783 | $33,949 |
Source: Public Records
Map
Nearby Homes
- 13 Brian Ct
- 909 Roger St
- 1431 Essex St
- 730 Chestnut Ct
- 700 Fairfield Ln
- 615 Harper Dr
- LOT 3 Blackhawk Dr
- 298 Apache Trail
- 135 Arquilla Dr
- 966 Mesa Dr
- 935 Viewpoint Dr
- 338 Hiawatha Dr
- 900 Windstone Ct
- 939 Mesa Dr
- 1920 Jester Ln
- 7 Falcon Ridge Ct
- 1820 Crofton Dr
- 1 N Hubbard St
- SWC Talaga and Algonquin Rd
- 145 S Oakleaf Rd
- 360 Country Ln
- 362 Country Ln
- 340 Country Ln
- 342 Country Ln
- 370 Country Ln
- 372 Country Ln
- 375 Stoney Brook Ct
- 330 Country Ln
- 335 Country Ln Unit 10
- 332 Country Ln
- 355 Country Ln
- 365 Stoney Brook Ct
- 1261 Parkwood Cir
- 380 Country Ln
- 382 Country Ln
- 355 Stoney Brook Ct
- 315 Country Ln
- 365 Country Ln
- 320 Country Ln
- 345 Country Ln Unit 10
Your Personal Tour Guide
Ask me questions while you tour the home.