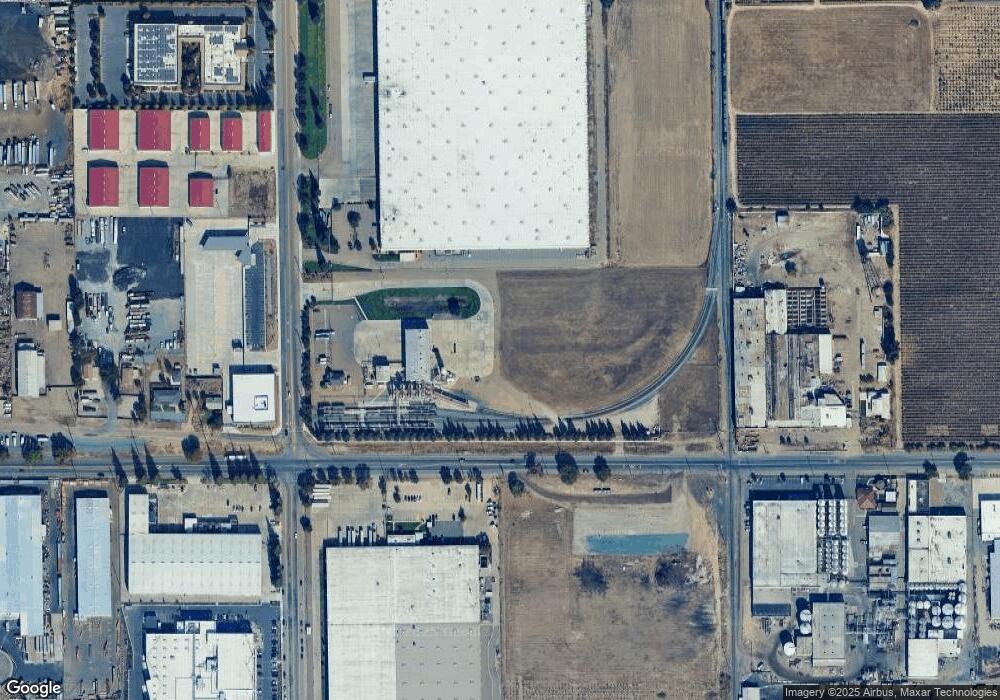
350 N Guild Ave Lodi, CA 95240
East Lodi Neighborhood
Studio
--
Bath
--
Sq Ft
605,048
Sq Ft Lot
About This Home
This home is located at 350 N Guild Ave, Lodi, CA 95240. 350 N Guild Ave is a home located in San Joaquin County with nearby schools including Victor Elementary School, Houston School, and Lodi High School.
Ownership History
Date
Name
Owned For
Owner Type
Purchase Details
Closed on
Sep 13, 2006
Sold by
Union Pacific Railroad Co
Bought by
Archer Daniels Midland Co
Purchase Details
Closed on
Dec 1, 2004
Sold by
P & D Loduca Llc
Bought by
Midland Archer Daniels
Purchase Details
Closed on
Dec 13, 2002
Sold by
Bingham Gordon Randall and Bingham Candy Eileen
Bought by
Batch Delmar D and Batch Doris
Purchase Details
Closed on
Dec 21, 2000
Sold by
Clearwater Environmental Inc
Bought by
Bingham Gordon Randall and Bingham Candy Eileen
Home Financials for this Owner
Home Financials are based on the most recent Mortgage that was taken out on this home.
Original Mortgage
$256,000
Interest Rate
7.71%
Mortgage Type
Seller Take Back
Purchase Details
Closed on
Sep 13, 1999
Sold by
Guthrie Gary
Bought by
Clearwater Environmental Inc
Create a Home Valuation Report for This Property
The Home Valuation Report is an in-depth analysis detailing your home's value as well as a comparison with similar homes in the area
Home Values in the Area
Average Home Value in this Area
Purchase History
| Date | Buyer | Sale Price | Title Company |
|---|---|---|---|
| Archer Daniels Midland Co | -- | None Available | |
| Midland Archer Daniels | -- | First Amer Title Co | |
| P & D Loduca Llc | -- | First Amer Title Co | |
| P & D Loduca Llc | -- | First Amer Title Co | |
| Batch Delmar D | $500,000 | First Amer Title Co | |
| Bingham Gordon Randall | $320,000 | Fidelity National Title | |
| Clearwater Environmental Inc | $300,000 | Chicago Title Co |
Source: Public Records
Mortgage History
| Date | Status | Borrower | Loan Amount |
|---|---|---|---|
| Previous Owner | Bingham Gordon Randall | $256,000 |
Source: Public Records
Tax History
| Year | Tax Paid | Tax Assessment Tax Assessment Total Assessment is a certain percentage of the fair market value that is determined by local assessors to be the total taxable value of land and additions on the property. | Land | Improvement |
|---|---|---|---|---|
| 2025 | $104,230 | $9,374,230 | $2,625,000 | $6,749,230 |
| 2024 | $107,647 | $9,771,830 | $2,625,000 | $7,146,830 |
| 2023 | $106,923 | $9,760,960 | $2,625,000 | $6,449,020 |
| 2022 | $110,751 | $10,142,390 | $2,625,000 | $7,517,390 |
| 2021 | $119,260 | $10,523,390 | $2,625,000 | $7,898,390 |
| 2020 | $124,917 | $11,211,060 | $2,625,000 | $8,586,060 |
| 2019 | $190,228 | $17,152,821 | $8,651,751 | $8,501,070 |
| 2018 | $193,603 | $17,360,489 | $8,482,109 | $8,878,380 |
| 2017 | $195,204 | $17,554,650 | $8,315,794 | $9,238,856 |
| 2016 | $191,850 | $18,046,331 | $8,152,776 | $9,893,555 |
| 2014 | $201,393 | $18,781,330 | $7,873,133 | $10,908,197 |
Source: Public Records
Map
Nearby Homes
- 177 San Marcos Dr
- 19 Rio Vista Dr
- 113 N Cherokee Ln
- 532 E Locust St
- 7076 E Highway 12
- 43 Rio Vista Dr
- 736 Golden Ave
- 427 E Locust St
- 505 E Oak St
- 505 Maple St
- 220 E Lodi Ave
- 625 N Sacramento St
- 0 W Turner Rd Unit 226006338
- 1200 Pixley Pkwy
- 101 W Lockeford St
- 705 N School St
- 312 Cherry St
- 518 N Church St
- 834 S Washington St
- 4678 E Woodbridge Rd
- 1575 E Victor Rd
- 271 N Guild Ave
- 1365 E Lockeford St
- 1347 E Lockeford St
- 495 N Guild Ave
- 1335 E Lockeford St
- 515 N Guild Ave
- 525 Guild Ave
- 499 N Guild Ave
- 225 N Guild Ave
- 535 Guild Ave
- 1320 E Victor Rd
- 545 Guild Ave
- 121 N Guild Ave
- 699 N Guild Ave
- 1235 E Lockeford St
- 1300 E Victor Rd
- 127 E Victor Rd
- 1371 E Pine St Unit 13
- 1371 E Pine St
Your Personal Tour Guide
Ask me questions while you tour the home.