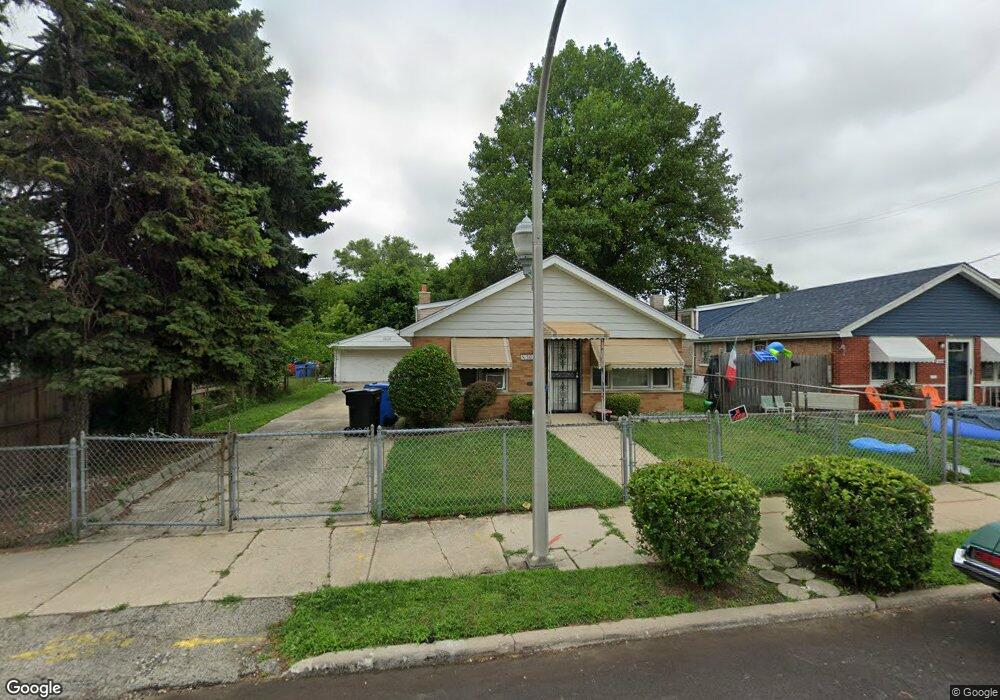
350 W 57th St Chicago, IL 60621
Englewood NeighborhoodEstimated Value: $85,000 - $269,000
2
Beds
1
Bath
1,075
Sq Ft
$149/Sq Ft
Est. Value
About This Home
This home is located at 350 W 57th St, Chicago, IL 60621 and is currently estimated at $160,347, approximately $149 per square foot. 350 W 57th St is a home located in Cook County with nearby schools including Sherwood Elementary School, KIPP Bloom Charter Elementary School, and Urban Prep Charter Academy for Young Men - Englewood.
Ownership History
Date
Name
Owned For
Owner Type
Purchase Details
Closed on
Jan 24, 2018
Sold by
Sails Eddie Mae
Bought by
Huff June M
Current Estimated Value
Home Financials for this Owner
Home Financials are based on the most recent Mortgage that was taken out on this home.
Original Mortgage
$52,040
Outstanding Balance
$44,750
Interest Rate
4.62%
Mortgage Type
FHA
Estimated Equity
$115,597
Purchase Details
Closed on
Dec 13, 1999
Sold by
Scott Lillie B
Bought by
Sails Eddie Mae
Home Financials for this Owner
Home Financials are based on the most recent Mortgage that was taken out on this home.
Original Mortgage
$57,000
Interest Rate
7.87%
Purchase Details
Closed on
Dec 18, 1997
Sold by
Chrones Lillie B and Scott Lillie B
Bought by
Scott Lillie B
Home Financials for this Owner
Home Financials are based on the most recent Mortgage that was taken out on this home.
Original Mortgage
$45,500
Interest Rate
10.34%
Create a Home Valuation Report for This Property
The Home Valuation Report is an in-depth analysis detailing your home's value as well as a comparison with similar homes in the area
Home Values in the Area
Average Home Value in this Area
Purchase History
| Date | Buyer | Sale Price | Title Company |
|---|---|---|---|
| Huff June M | $53,000 | First American Title | |
| Sails Eddie Mae | $60,000 | Chicago Title Insurance Co | |
| Scott Lillie B | -- | -- | |
| Scott Lillie B | -- | -- |
Source: Public Records
Mortgage History
| Date | Status | Borrower | Loan Amount |
|---|---|---|---|
| Open | Huff June M | $52,040 | |
| Previous Owner | Sails Eddie Mae | $57,000 | |
| Previous Owner | Scott Lillie B | $45,500 |
Source: Public Records
Tax History Compared to Growth
Tax History
| Year | Tax Paid | Tax Assessment Tax Assessment Total Assessment is a certain percentage of the fair market value that is determined by local assessors to be the total taxable value of land and additions on the property. | Land | Improvement |
|---|---|---|---|---|
| 2024 | -- | $8,301 | $1,544 | $6,757 |
| 2023 | -- | $5,000 | $2,737 | $2,263 |
| 2022 | $0 | $5,000 | $2,737 | $2,263 |
| 2021 | $2,318 | $4,999 | $2,737 | $2,262 |
| 2020 | $2,318 | $10,404 | $3,344 | $7,060 |
| 2019 | $2,323 | $11,561 | $3,344 | $8,217 |
| 2018 | $1,605 | $11,561 | $3,344 | $8,217 |
| 2017 | $2,569 | $15,308 | $3,087 | $12,221 |
| 2016 | $2,566 | $15,308 | $3,087 | $12,221 |
| 2015 | $2,324 | $15,308 | $3,087 | $12,221 |
| 2014 | $1,942 | $13,036 | $2,829 | $10,207 |
| 2013 | $1,893 | $13,036 | $2,829 | $10,207 |
Source: Public Records
Map
Nearby Homes
- 5639 S Princeton Ave Unit 43
- 5549 S Shields Ave
- 5756 S Princeton Ave
- 5746 S Wells St
- 5533 S Princeton Ave
- 311 W Garfield Blvd
- 1050 W 57th St
- 43-47 W Garfield Blvd
- 5920 S Princeton Ave
- 5805 S La Salle St
- 347 W 59th Place
- 5751 S Lowe Ave
- 5944 S Princeton Ave
- 5610 S Lowe Ave
- 346 W 60th St
- 5621 S Perry Ave
- 5619 S Perry Ave
- 5906 S La Salle St
- 352 W 59th St
- 5938 S La Salle St
- 346 W 57th St Unit 1
- 354 W 57th St
- 353 W 56th Place
- 351 W 56th Place
- 5654 S Shields Ave
- 5656 S Shields Ave
- 5650 S Shields Ave Unit 1
- 5642 S Shields Ave
- 355 W 56th Place
- 5644 S Shields Ave
- 5644 S Shields Ave
- 5638 S Shields Ave
- 357 W 56th Place
- 5634 S Shields Ave
- 5625 S Shields Ave
- 5630 S Shields Ave
- 407 W 56th Place
- 5647 S Shields Ave
- 5647 S Shields Ave
- 5649 S Shields Ave