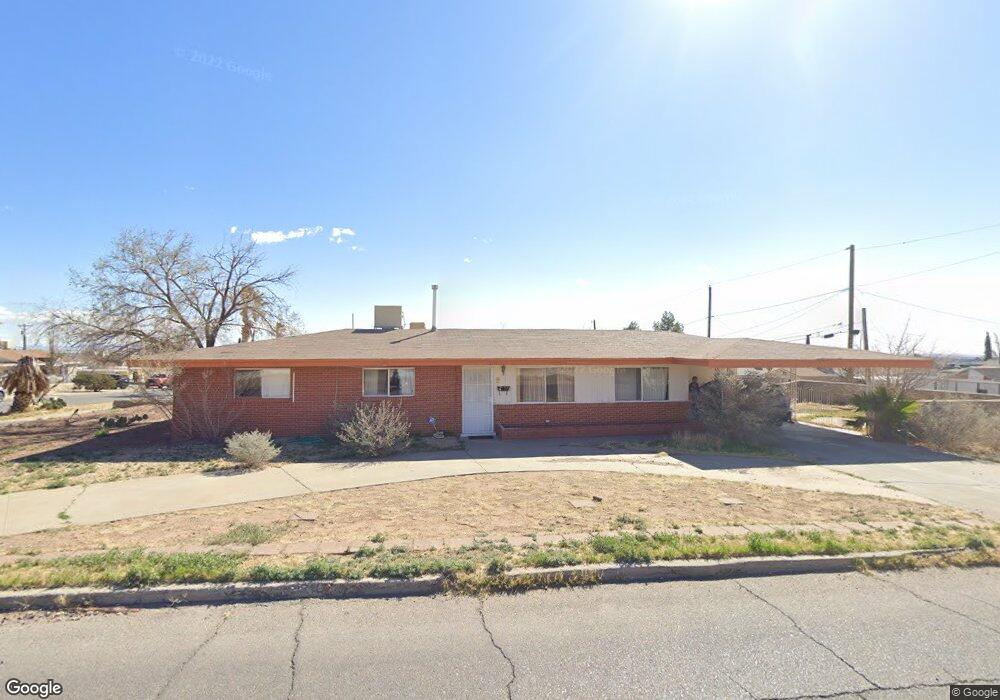
3500 Tyler Ave El Paso, TX 79930
Central NeighborhoodEstimated Value: $188,973
--
Bed
2
Baths
1,484
Sq Ft
$127/Sq Ft
Est. Value
About This Home
This home is located at 3500 Tyler Ave, El Paso, TX 79930 and is currently priced at $188,973, approximately $127 per square foot. 3500 Tyler Ave is a home located in El Paso County with nearby schools including Travis Elementary School, Middle School-5 NW Middle, and Chapin High School.
Ownership History
Date
Name
Owned For
Owner Type
Purchase Details
Closed on
Aug 31, 2006
Sold by
Gallardo Enrique and Gallardo Herlinda
Bought by
Board Of Trustees Of The Unitarian Unive
Current Estimated Value
Home Financials for this Owner
Home Financials are based on the most recent Mortgage that was taken out on this home.
Original Mortgage
$33,500
Outstanding Balance
$20,173
Interest Rate
6.72%
Mortgage Type
Seller Take Back
Purchase Details
Closed on
Jul 4, 2006
Sold by
Marquez Patricia Jo and Marquez Charles
Bought by
Gallarado Enrique
Home Financials for this Owner
Home Financials are based on the most recent Mortgage that was taken out on this home.
Original Mortgage
$33,500
Outstanding Balance
$20,173
Interest Rate
6.72%
Mortgage Type
Seller Take Back
Purchase Details
Closed on
Aug 3, 1999
Sold by
Portillo Gustavo Robert
Bought by
Marquez Patricia Portillo
Create a Home Valuation Report for This Property
The Home Valuation Report is an in-depth analysis detailing your home's value as well as a comparison with similar homes in the area
Home Values in the Area
Average Home Value in this Area
Purchase History
| Date | Buyer | Sale Price | Title Company |
|---|---|---|---|
| Board Of Trustees Of The Unitarian Unive | -- | None Available | |
| Gallarado Enrique | $74,000 | None Available | |
| Marquez Patricia Portillo | -- | -- |
Source: Public Records
Mortgage History
| Date | Status | Borrower | Loan Amount |
|---|---|---|---|
| Open | Board Of Trustees Of The Unitarian Unive | $33,500 |
Source: Public Records
Tax History Compared to Growth
Tax History
| Year | Tax Paid | Tax Assessment Tax Assessment Total Assessment is a certain percentage of the fair market value that is determined by local assessors to be the total taxable value of land and additions on the property. | Land | Improvement |
|---|---|---|---|---|
| 2025 | -- | $196,297 | $24,682 | $171,615 |
| 2024 | -- | $180,696 | $24,682 | $156,014 |
| 2023 | $4,220 | $152,570 | $14,692 | $137,878 |
| 2022 | $4,471 | $151,046 | $14,692 | $136,354 |
| 2021 | $2,639 | $84,536 | $14,692 | $69,844 |
| 2020 | $2,387 | $77,650 | $14,692 | $62,958 |
| 2018 | $2,198 | $74,261 | $14,692 | $59,569 |
| 2017 | $2,171 | $77,091 | $14,692 | $62,399 |
| 2016 | $2,171 | $77,091 | $14,692 | $62,399 |
| 2015 | -- | $83,331 | $14,692 | $68,639 |
| 2014 | -- | $85,108 | $14,692 | $70,416 |
Source: Public Records
Map
Nearby Homes
- 3501 Polk Ave
- 3501 Taylor Ave
- 3413 Monroe Ave
- 3312 Polk Ave
- 3104 Van Buren Ave
- 3906 Taylor Ave
- 3905 Monroe Ave
- 3704 Mckinley Ave
- 3021 Monroe Ave
- 3901 Mckinley Ave
- 3010 Pierce Ave
- 3806 Mountain Ave
- 3831 Mountain Ave
- 3808 Johnson Ave
- 3606 Morehead Ave
- 3904 N Piedras St Unit A-B
- 3921 Nations Ave
- 2801 Polk Ave
- 3027 Morehead Ave
- 4029 Lincoln Ave
- 3504 Tyler Ave
- 3506 Tyler Ave
- 3501 Harrison Ave
- 3505 Harrison Ave
- 3509 Harrison Ave
- 3501 Tyler Ave
- 3508 Tyler Ave
- 3505 Tyler Ave
- 3513 Harrison Ave
- 3509 Tyler Ave
- 3431 Tyler Ave
- 3429 Harrison Ave
- 3513 Tyler Ave
- 3517 Harrison Ave
- 3520 Tyler Ave
- 3427 Tyler Ave
- 3517 Tyler Ave
- 3523 Harrison Ave
- 3421 Tyler Ave
- 3526 Tyler Ave