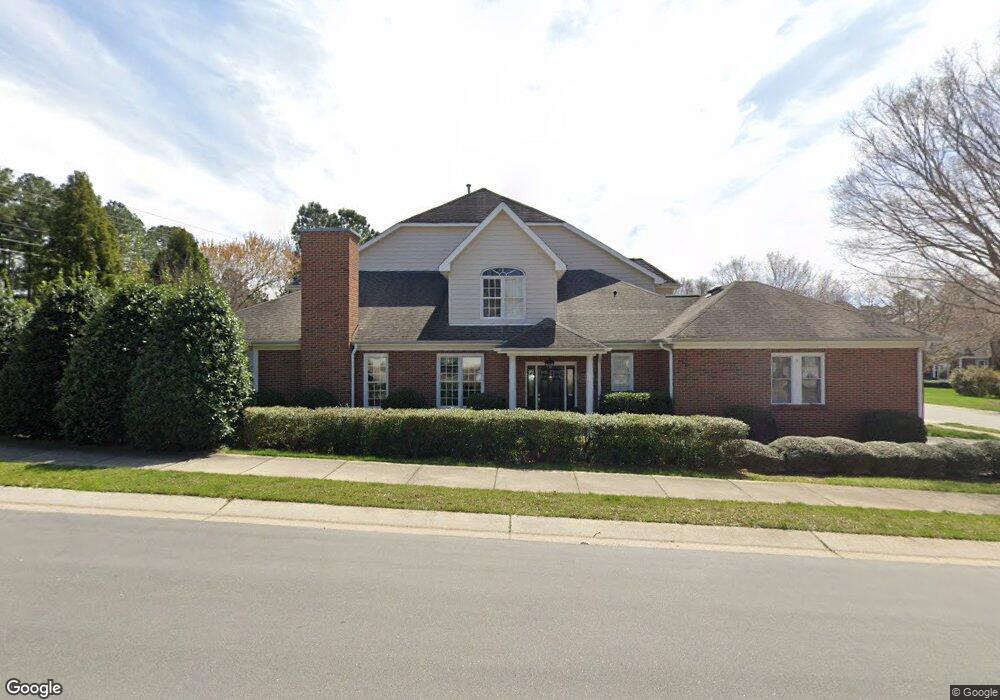
3501 Barron Berkeley Way Raleigh, NC 27612
Umstead NeighborhoodEstimated Value: $752,000 - $780,000
3
Beds
3
Baths
2,888
Sq Ft
$264/Sq Ft
Est. Value
About This Home
This home is located at 3501 Barron Berkeley Way, Raleigh, NC 27612 and is currently estimated at $763,079, approximately $264 per square foot. 3501 Barron Berkeley Way is a home located in Wake County with nearby schools including Stough Elementary School, Oberlin Middle School, and Broughton Magnet High School.
Ownership History
Date
Name
Owned For
Owner Type
Purchase Details
Closed on
Mar 7, 2005
Sold by
Massengill Mark A and Massengill Terri S
Bought by
Tolley Charles R and Tolley Brenda J
Current Estimated Value
Home Financials for this Owner
Home Financials are based on the most recent Mortgage that was taken out on this home.
Original Mortgage
$300,000
Outstanding Balance
$144,582
Interest Rate
4.87%
Mortgage Type
Fannie Mae Freddie Mac
Estimated Equity
$618,497
Purchase Details
Closed on
Mar 30, 2000
Sold by
Premiere Homes Ii Inc
Bought by
Massengill Mark and Massengill Terri
Home Financials for this Owner
Home Financials are based on the most recent Mortgage that was taken out on this home.
Original Mortgage
$252,700
Interest Rate
8.38%
Create a Home Valuation Report for This Property
The Home Valuation Report is an in-depth analysis detailing your home's value as well as a comparison with similar homes in the area
Home Values in the Area
Average Home Value in this Area
Purchase History
| Date | Buyer | Sale Price | Title Company |
|---|---|---|---|
| Tolley Charles R | $375,000 | -- | |
| Massengill Mark | $359,000 | -- |
Source: Public Records
Mortgage History
| Date | Status | Borrower | Loan Amount |
|---|---|---|---|
| Open | Tolley Charles R | $300,000 | |
| Previous Owner | Massengill Mark | $252,700 |
Source: Public Records
Tax History Compared to Growth
Tax History
| Year | Tax Paid | Tax Assessment Tax Assessment Total Assessment is a certain percentage of the fair market value that is determined by local assessors to be the total taxable value of land and additions on the property. | Land | Improvement |
|---|---|---|---|---|
| 2025 | $5,755 | $657,634 | $104,500 | $553,134 |
| 2024 | $5,732 | $657,634 | $104,500 | $553,134 |
| 2023 | $5,083 | $464,454 | $79,000 | $385,454 |
| 2022 | $4,723 | $464,454 | $79,000 | $385,454 |
| 2021 | $4,539 | $464,454 | $79,000 | $385,454 |
| 2020 | $4,456 | $464,454 | $79,000 | $385,454 |
| 2019 | $4,942 | $424,733 | $76,000 | $348,733 |
| 2018 | $4,661 | $424,733 | $76,000 | $348,733 |
| 2017 | $4,439 | $424,733 | $76,000 | $348,733 |
| 2016 | $4,347 | $424,733 | $76,000 | $348,733 |
| 2015 | $4,454 | $428,158 | $80,000 | $348,158 |
| 2014 | $4,224 | $428,158 | $80,000 | $348,158 |
Source: Public Records
Map
Nearby Homes
- 3700 Baron Cooper Pass Unit 302
- 3701 Baron Cooper Pass Unit 303
- 3421 Barron Berkeley Way
- 3417 Sir Colleton Ct
- 4016 Edward Pride Wynd
- 3926 Lost Fawn Ct
- 3924 Lost Fawn Ct
- 3922 Lost Fawn Ct
- 3559 Mill Run Unit 45
- 3213 Mill Run Unit 174
- 3561 Mill Run
- 3908 Lost Fawn Ct
- 3291 Mill Run Unit 149
- 3705 Old Post Rd
- Wade 2 Plan at Parc at Laurel Hills
- 5848 Carriage Dr
- 5856 Carriage Dr
- 5861 Carriage Dr
- 5816 Carriage Dr
- 5852 Carriage Dr
- 3981 Burwell Rollins Cir
- 3503 Barron Berkeley Way
- 3505 Barron Berkeley Way
- 3507 Barron Berkeley Way
- 3509 Barron Berkeley Way
- 3809 Burwell Rollins Cir
- 3906 Burwell Rollins Cir
- 3904 Burwell Rollins Cir
- 3908 Burwell Rollins Cir
- 3902 Burwell Rollins Cir
- 3511 Barron Berkeley Way
- 3807 Burwell Rollins Cir
- 3810 Burwell Rollins Cir
- 3805 Burwell Rollins Cir
- 3520 Barron Berkeley Way
- 3100 Baron Cooper Pass Unit 104
- 3100 Baron Cooper Pass
- 3781 Camp Mangum Wynd
- 3808 Burwell Rollins Cir
- 3521 Barron Berkeley Way