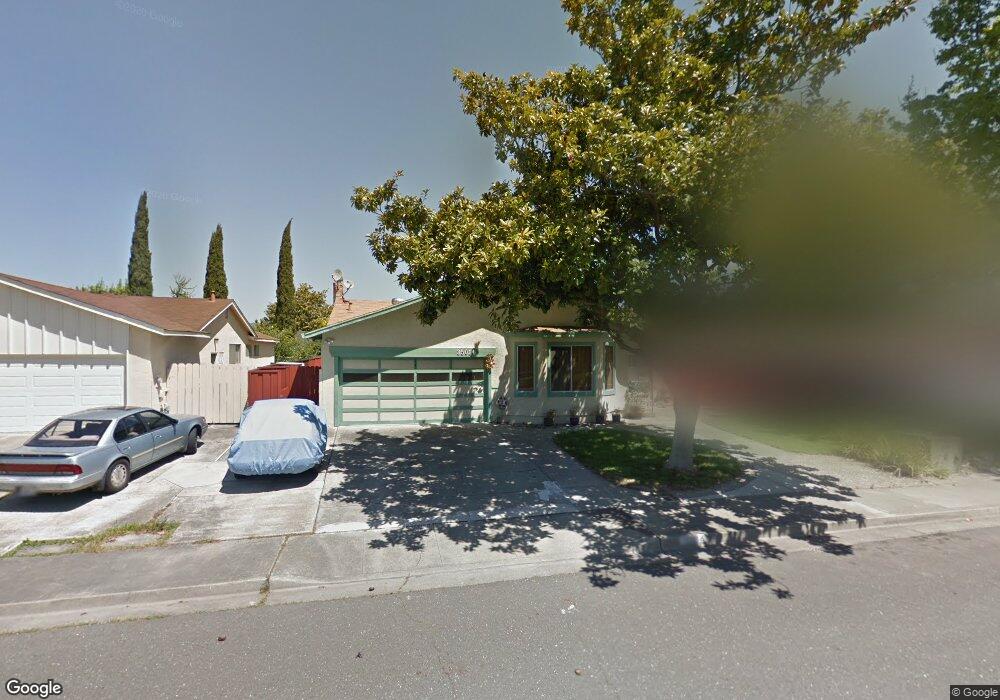
35014 Begonia St Union City, CA 94587
Downtown Union City NeighborhoodEstimated Value: $1,389,000 - $1,492,000
4
Beds
2
Baths
1,550
Sq Ft
$931/Sq Ft
Est. Value
About This Home
This home is located at 35014 Begonia St, Union City, CA 94587 and is currently estimated at $1,443,170, approximately $931 per square foot. 35014 Begonia St is a home located in Alameda County with nearby schools including Searles Elementary School, Cesar Chavez Middle School, and James Logan High School.
Ownership History
Date
Name
Owned For
Owner Type
Purchase Details
Closed on
Mar 17, 2017
Sold by
Wong Wong Elaine N Elaine N and Wong Steven Y
Bought by
Wong Elaine N and Elaine N Wong Revocable Trust
Current Estimated Value
Purchase Details
Closed on
Aug 3, 2010
Sold by
Wong Steven Y and Wong Elaine N
Bought by
Wong Steven Y and Wong Elaine N
Create a Home Valuation Report for This Property
The Home Valuation Report is an in-depth analysis detailing your home's value as well as a comparison with similar homes in the area
Home Values in the Area
Average Home Value in this Area
Purchase History
| Date | Buyer | Sale Price | Title Company |
|---|---|---|---|
| Wong Elaine N | -- | None Available | |
| Wong Steven Y | -- | None Available |
Source: Public Records
Tax History Compared to Growth
Tax History
| Year | Tax Paid | Tax Assessment Tax Assessment Total Assessment is a certain percentage of the fair market value that is determined by local assessors to be the total taxable value of land and additions on the property. | Land | Improvement |
|---|---|---|---|---|
| 2025 | $3,429 | $149,802 | $110,945 | $45,857 |
| 2024 | $3,429 | $146,728 | $108,770 | $44,958 |
| 2023 | $3,257 | $150,715 | $106,638 | $44,077 |
| 2022 | $3,165 | $140,759 | $104,547 | $43,212 |
| 2021 | $3,092 | $137,862 | $102,497 | $42,365 |
| 2020 | $3,077 | $143,378 | $101,447 | $41,931 |
| 2019 | $3,084 | $140,567 | $99,458 | $41,109 |
| 2018 | $3,005 | $137,811 | $97,508 | $40,303 |
| 2017 | $2,929 | $135,110 | $95,597 | $39,513 |
| 2016 | $2,826 | $132,461 | $93,723 | $38,738 |
| 2015 | $2,763 | $130,472 | $92,315 | $38,157 |
| 2014 | $2,657 | $127,916 | $90,507 | $37,409 |
Source: Public Records
Map
Nearby Homes
- 34915 Osprey Dr
- 34926 Moina Shaiq Common
- 2224 Peacock Place Unit 3
- 34915 Skylark Dr
- 2221 Partridge Way Unit 3
- 34981 Skylark Dr
- 2139 Canary Ct Unit 2
- 3100 Mackenzie Place
- 2404 Maraschino Place
- 1889 Flagstone Dr
- 35624 Mccarty Common
- 35990 Copper St
- 34917 Sea Cliff Terrace
- 1027 Chalcedony Terrace
- 35282 Cano Ct
- 35563 Linda Dr
- 34179 Bowling Green Common
- 4251 Nicolet Ave
- 457 Calistoga Cir
- 409 King Ave
- 35018 Begonia St
- 35012 Begonia St
- 35017 Hollyhock St
- 35021 Hollyhock St
- 35013 Hollyhock St
- 35008 Begonia St
- 35022 Begonia St
- 35009 Hollyhock St
- 35025 Hollyhock St
- 35015 Begonia St
- 35013 Begonia St
- 35019 Begonia St
- 35004 Begonia St
- 35009 Begonia St
- 35021 Begonia St
- 35005 Hollyhock St
- 35002 Begonia St
- 35005 Begonia St
- 35030 Begonia St
- 35001 Hollyhock St