Estimated Value: $170,000 - $273,000
4
Beds
2
Baths
962
Sq Ft
$237/Sq Ft
Est. Value
About This Home
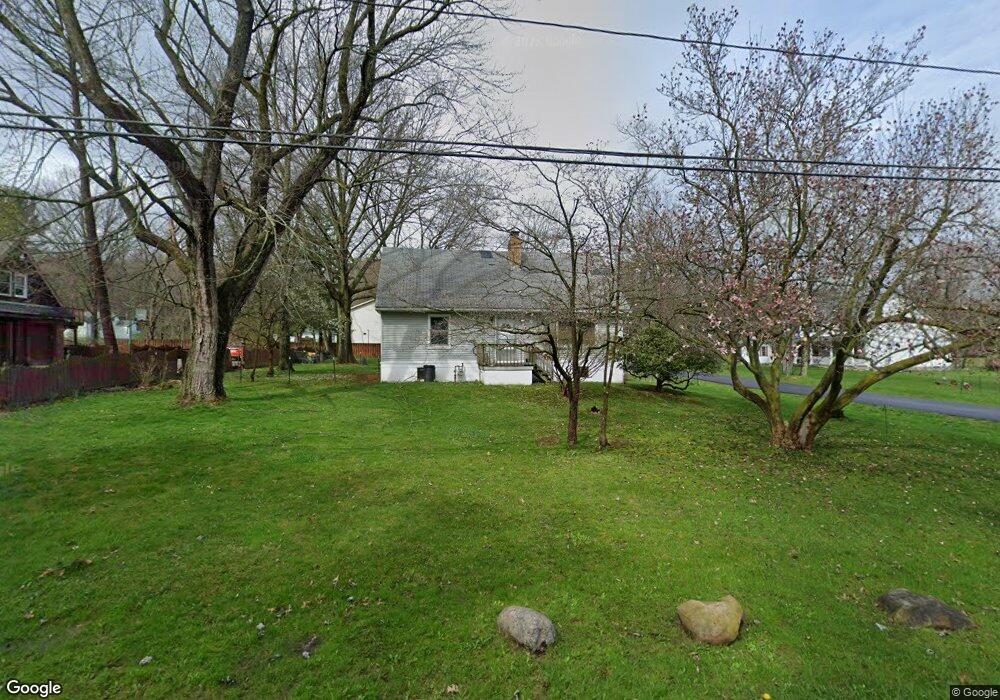
This home is located at 3502 Marsh Rd, Stow, OH 44224 and is currently estimated at $228,408, approximately $237 per square foot. 3502 Marsh Rd is a home located in Summit County with nearby schools including Stow-Munroe Falls High School, Holy Family Elementary School, and St Patrick Elementary School.
Ownership History
Date
Name
Owned For
Owner Type
Purchase Details
Closed on
Dec 23, 2024
Sold by
Glendenning Jennifer L
Bought by
Glendenning Preservation Trust and Glendenning
Current Estimated Value
Purchase Details
Closed on
Aug 9, 2006
Sold by
Wiggins Christine and Rignola Christine
Bought by
Glendenning Jennifer L
Home Financials for this Owner
Home Financials are based on the most recent Mortgage that was taken out on this home.
Original Mortgage
$92,500
Interest Rate
8.5%
Mortgage Type
Purchase Money Mortgage
Create a Home Valuation Report for This Property
The Home Valuation Report is an in-depth analysis detailing your home's value as well as a comparison with similar homes in the area
Home Values in the Area
Average Home Value in this Area
Purchase History
| Date | Buyer | Sale Price | Title Company |
|---|---|---|---|
| Glendenning Preservation Trust | -- | None Listed On Document | |
| Glendenning Preservation Trust | -- | None Listed On Document | |
| Glendenning Jennifer L | $92,500 | Clear Trust Title |
Source: Public Records
Mortgage History
| Date | Status | Borrower | Loan Amount |
|---|---|---|---|
| Previous Owner | Glendenning Jennifer L | $92,500 |
Source: Public Records
Tax History
| Year | Tax Paid | Tax Assessment Tax Assessment Total Assessment is a certain percentage of the fair market value that is determined by local assessors to be the total taxable value of land and additions on the property. | Land | Improvement |
|---|---|---|---|---|
| 2025 | $3,624 | $61,943 | $12,194 | $49,749 |
| 2024 | $3,510 | $61,943 | $12,194 | $49,749 |
| 2023 | $3,510 | $61,943 | $12,194 | $49,749 |
| 2022 | $3,153 | $49,071 | $9,601 | $39,470 |
| 2021 | $2,825 | $49,071 | $9,601 | $39,470 |
| 2020 | $2,777 | $49,070 | $9,600 | $39,470 |
| 2019 | $2,634 | $29,900 | $8,580 | $21,320 |
| 2018 | $2,605 | $29,900 | $8,580 | $21,320 |
| 2017 | $2,693 | $29,900 | $8,580 | $21,320 |
| 2016 | $2,639 | $29,090 | $8,580 | $20,510 |
| 2015 | $2,693 | $29,090 | $8,580 | $20,510 |
| 2014 | $3,420 | $29,090 | $8,580 | $20,510 |
| 2013 | $1,793 | $29,090 | $8,580 | $20,510 |
Source: Public Records
Map
Nearby Homes
- 2738 Stockman Ct
- 2721 Santa Anita Dr
- 2944 Heatherwood Ct
- 1302 Carol Dr
- 3753 Lake Run Blvd
- 3313 Crown Pointe Dr
- 3767 Lake Run Blvd
- 601 Silver Meadows Blvd
- 850 Marilyn Dr
- 3874 Lake Run Blvd
- 511 Suzanne Dr
- 0 Middlebury Rd
- 726 Hughey Dr
- 884 Highridge Ln
- 0 Vira Rd
- 3828 Osage St Unit 3832
- 396 Hiwood Ave
- 245 Bermont Ave
- 2293 Wickley Ave
- 2144 Echo Rd
- 3492 Marsh Rd
- 2916 Whit Ave
- 2946 Fox Burrow Dr
- 2957 Mourning Dove Cir
- 3480 Marsh Rd
- 2956 Mourning Dove Cir
- 2900 Whit Ave
- 2958 Fox Burrow Dr
- 2965 Mourning Dove Cir
- 2909 Kenny Ave
- 2962 Mourning Dove Cir
- 2947 Fox Burrow Dr
- 2976 Fox Burrow Dr
- 3466 Marsh Rd
- 2955 Fox Burrow Dr
- 2929 Whit Ave
- 2887 Whit Ave Unit 2889
- 3479 Hunters Crossing
- 3456 Marsh Rd
- 2984 Fox Burrow Dr
Your Personal Tour Guide
Ask me questions while you tour the home.