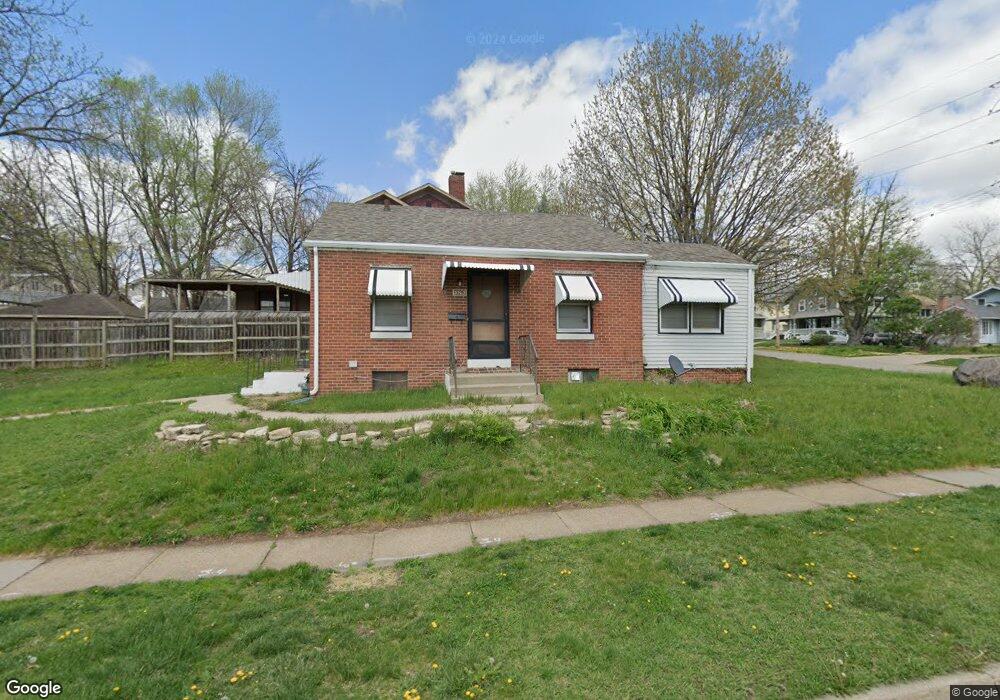
3503 Crocker St Des Moines, IA 50312
Drake NeighborhoodEstimated Value: $184,348 - $203,000
2
Beds
1
Bath
820
Sq Ft
$237/Sq Ft
Est. Value
About This Home
This home is located at 3503 Crocker St, Des Moines, IA 50312 and is currently estimated at $194,087, approximately $236 per square foot. 3503 Crocker St is a home located in Polk County with nearby schools including Hubbell Elementary, Roosevelt High School, and St Augustin Catholic School.
Ownership History
Date
Name
Owned For
Owner Type
Purchase Details
Closed on
Mar 22, 2016
Sold by
M & T Bank
Bought by
Dubuque Street Properties
Current Estimated Value
Purchase Details
Closed on
Sep 4, 2010
Sold by
Mock Jodi Jean
Bought by
Quinn Gordon David
Purchase Details
Closed on
Nov 29, 2005
Sold by
Preister Peggy S and Estate Of Jeremie I Swartz
Bought by
Quinn Gordon David
Home Financials for this Owner
Home Financials are based on the most recent Mortgage that was taken out on this home.
Original Mortgage
$77,425
Interest Rate
6.36%
Mortgage Type
Fannie Mae Freddie Mac
Purchase Details
Closed on
Oct 28, 2002
Sold by
Swartz Jeremie Ingley
Bought by
City Of Des Moines
Purchase Details
Closed on
Sep 3, 2002
Sold by
Swartz Jeremie Ingley
Bought by
Iowa Department Of Transportation
Create a Home Valuation Report for This Property
The Home Valuation Report is an in-depth analysis detailing your home's value as well as a comparison with similar homes in the area
Home Values in the Area
Average Home Value in this Area
Purchase History
| Date | Buyer | Sale Price | Title Company |
|---|---|---|---|
| Dubuque Street Properties | $44,500 | None Available | |
| Quinn Gordon David | -- | None Available | |
| Quinn Gordon David | $80,000 | Itc | |
| City Of Des Moines | $58,500 | -- | |
| Iowa Department Of Transportation | -- | -- |
Source: Public Records
Mortgage History
| Date | Status | Borrower | Loan Amount |
|---|---|---|---|
| Previous Owner | Quinn Gordon David | $77,425 |
Source: Public Records
Tax History Compared to Growth
Tax History
| Year | Tax Paid | Tax Assessment Tax Assessment Total Assessment is a certain percentage of the fair market value that is determined by local assessors to be the total taxable value of land and additions on the property. | Land | Improvement |
|---|---|---|---|---|
| 2025 | $2,954 | $181,900 | $41,900 | $140,000 |
| 2024 | $2,954 | $150,200 | $37,900 | $112,300 |
| 2023 | $2,938 | $166,800 | $37,900 | $128,900 |
| 2022 | $2,916 | $141,300 | $33,200 | $108,100 |
| 2021 | $2,774 | $141,300 | $33,200 | $108,100 |
| 2020 | $2,882 | $127,800 | $30,000 | $97,800 |
| 2019 | $2,618 | $127,800 | $30,000 | $97,800 |
| 2018 | $2,592 | $114,000 | $26,000 | $88,000 |
| 2017 | $2,684 | $114,000 | $26,000 | $88,000 |
| 2016 | $2,688 | $99,200 | $23,700 | $75,500 |
| 2015 | $2,688 | $110,700 | $25,000 | $85,700 |
| 2014 | $2,570 | $105,400 | $23,300 | $82,100 |
Source: Public Records
Map
Nearby Homes