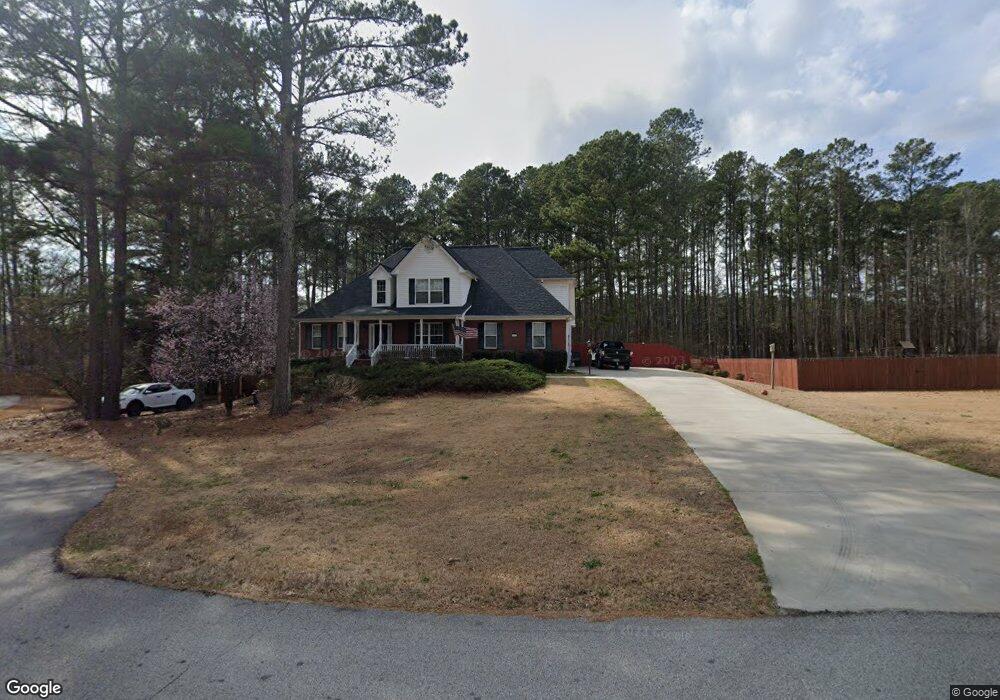
3504 Pebble Brook Ln Stockbridge, GA 30281
Estimated Value: $359,354 - $432,000
4
Beds
4
Baths
2,167
Sq Ft
$184/Sq Ft
Est. Value
About This Home
This home is located at 3504 Pebble Brook Ln, Stockbridge, GA 30281 and is currently estimated at $398,589, approximately $183 per square foot. 3504 Pebble Brook Ln is a home located in Rockdale County with nearby schools including Lorraine Elementary School, Gen. Ray Davis Middle School, and Heritage High School.
Ownership History
Date
Name
Owned For
Owner Type
Purchase Details
Closed on
May 30, 2019
Sold by
Bates Reena L
Bought by
Bates Reena L and Davis Dianna P
Current Estimated Value
Purchase Details
Closed on
Apr 4, 2019
Sold by
Davis Dianna P
Bought by
Bates Reena L
Purchase Details
Closed on
Nov 30, 2012
Sold by
Bates Reena L
Bought by
Bates Reena L and Davis Dianna P
Home Financials for this Owner
Home Financials are based on the most recent Mortgage that was taken out on this home.
Original Mortgage
$146,301
Interest Rate
3.25%
Mortgage Type
FHA
Purchase Details
Closed on
Aug 6, 2004
Sold by
Zuber Construction Inc
Bought by
Greene Alan E and Greene Christine
Home Financials for this Owner
Home Financials are based on the most recent Mortgage that was taken out on this home.
Original Mortgage
$172,700
Interest Rate
5.4%
Mortgage Type
New Conventional
Create a Home Valuation Report for This Property
The Home Valuation Report is an in-depth analysis detailing your home's value as well as a comparison with similar homes in the area
Home Values in the Area
Average Home Value in this Area
Purchase History
| Date | Buyer | Sale Price | Title Company |
|---|---|---|---|
| Bates Reena L | -- | -- | |
| Bates Reena L | $30,000 | -- | |
| Bates Reena L | -- | -- | |
| Bates Reena L | $149,000 | -- | |
| Greene Alan E | $215,900 | -- |
Source: Public Records
Mortgage History
| Date | Status | Borrower | Loan Amount |
|---|---|---|---|
| Previous Owner | Bates Reena L | $146,301 | |
| Previous Owner | Greene Alan E | $172,700 |
Source: Public Records
Tax History Compared to Growth
Tax History
| Year | Tax Paid | Tax Assessment Tax Assessment Total Assessment is a certain percentage of the fair market value that is determined by local assessors to be the total taxable value of land and additions on the property. | Land | Improvement |
|---|---|---|---|---|
| 2024 | $3,836 | $155,040 | $26,400 | $128,640 |
| 2023 | $3,157 | $133,520 | $26,360 | $107,160 |
| 2022 | $2,653 | $113,880 | $23,960 | $89,920 |
| 2021 | $2,390 | $97,520 | $18,400 | $79,120 |
| 2020 | $1,946 | $79,840 | $15,240 | $64,600 |
| 2019 | $1,912 | $77,160 | $15,240 | $61,920 |
| 2018 | $1,748 | $71,480 | $17,640 | $53,840 |
| 2017 | $1,596 | $65,880 | $10,320 | $55,560 |
| 2016 | $1,473 | $65,880 | $10,320 | $55,560 |
| 2015 | $1,425 | $64,120 | $8,560 | $55,560 |
| 2014 | $1,210 | $61,680 | $8,560 | $53,120 |
| 2013 | -- | $77,800 | $14,000 | $63,800 |
Source: Public Records
Map
Nearby Homes
- 3488 Pebble Brook Ln
- 4454 Foxfire Crossing
- 3580 Limberlost Trail SW
- 3735 Millstream Ln
- 3180 Jackson Creek Dr
- 3183 Jackson Creek Dr
- 2170 Autumn Chase Dr
- 3179 Jackson Creek Dr
- 2400 Wild Oak Ct Unit 76
- 4850 Highway 138 SW
- 2700 Morgan Ct
- 2641 Morgan Park Dr
- 3669 E Fairview Rd SW
- 2640 Morgan Park Dr
- 4925 Cook Rd SW
- 222 Hemlock Dr
- 119 Valley Rd
- 3502 Pebble Brook Ln
- 3506 Pebble Brook Ln Unit 7
- 3501 Pebble Brook Ln
- 3505 Pebble Brook Ln
- 3500 Pebble Brook Ln
- 3503 Pebble Brook Ln Unit 7
- 3499 Pebble Brook Ln Unit 7
- 4488 Highway 138 SW
- 3498 Pebble Brook Ln
- 3602 Limberlost Trail SW
- 3497 Pebble Brook Ln
- 4540 Highway 138 SW
- 4540 Highway 138 SW
- 4502 Georgia 138
- 4502 Highway 138 SW
- 4466 Highway 138 SW
- 3598 Limberlost Trail SW
- 3496 Pebble Brook Ln
- 3600 Limberlost Trail SW
- 4550 Highway 138 SW