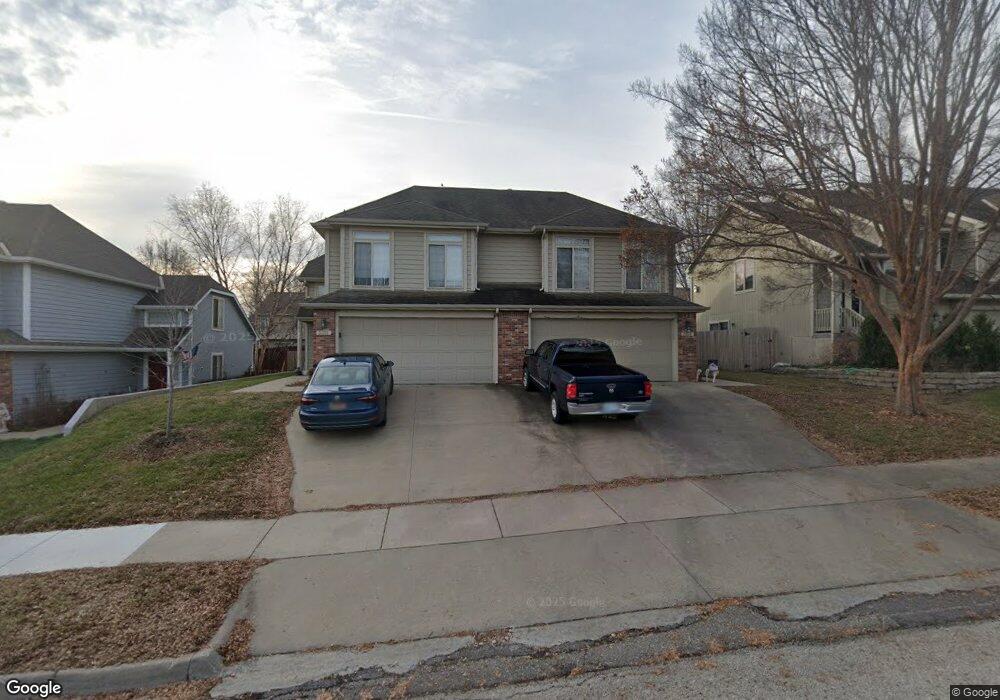
3505 Sweetgrass Ct Lawrence, KS 66049
Estimated Value: $420,792 - $469,000
6
Beds
6
Baths
2,868
Sq Ft
$154/Sq Ft
Est. Value
About This Home
This home is located at 3505 Sweetgrass Ct, Lawrence, KS 66049 and is currently estimated at $442,448, approximately $154 per square foot. 3505 Sweetgrass Ct is a home located in Douglas County with nearby schools including Deerfield Elementary School, West Middle School, and Lawrence Free State High School.
Ownership History
Date
Name
Owned For
Owner Type
Purchase Details
Closed on
May 4, 2021
Sold by
Rauckman Gary L and Rauckman Kathy
Bought by
Curly Bouncer Llc
Current Estimated Value
Home Financials for this Owner
Home Financials are based on the most recent Mortgage that was taken out on this home.
Original Mortgage
$281,792
Outstanding Balance
$255,374
Interest Rate
3.1%
Mortgage Type
Future Advance Clause Open End Mortgage
Estimated Equity
$187,074
Purchase Details
Closed on
May 9, 2003
Sold by
Gary Rauckman Builders Inc
Bought by
Rauckman Gary L and Rauckman Kathy
Home Financials for this Owner
Home Financials are based on the most recent Mortgage that was taken out on this home.
Original Mortgage
$203,000
Interest Rate
5.87%
Mortgage Type
Purchase Money Mortgage
Purchase Details
Closed on
Feb 5, 2002
Sold by
North Stephens Lc
Bought by
Gary Rauckman Builders Inc
Home Financials for this Owner
Home Financials are based on the most recent Mortgage that was taken out on this home.
Original Mortgage
$197,105
Interest Rate
6.83%
Create a Home Valuation Report for This Property
The Home Valuation Report is an in-depth analysis detailing your home's value as well as a comparison with similar homes in the area
Home Values in the Area
Average Home Value in this Area
Purchase History
| Date | Buyer | Sale Price | Title Company |
|---|---|---|---|
| Curly Bouncer Llc | -- | Security 1St Title | |
| Rauckman Gary L | -- | Commerce Title | |
| Gary Rauckman Builders Inc | -- | -- |
Source: Public Records
Mortgage History
| Date | Status | Borrower | Loan Amount |
|---|---|---|---|
| Open | Curly Bouncer Llc | $281,792 | |
| Previous Owner | Rauckman Gary L | $203,000 | |
| Previous Owner | Gary Rauckman Builders Inc | $197,105 |
Source: Public Records
Tax History Compared to Growth
Tax History
| Year | Tax Paid | Tax Assessment Tax Assessment Total Assessment is a certain percentage of the fair market value that is determined by local assessors to be the total taxable value of land and additions on the property. | Land | Improvement |
|---|---|---|---|---|
| 2025 | $6,011 | $48,220 | $7,475 | $40,745 |
| 2024 | $5,774 | $46,348 | $7,475 | $38,873 |
| 2023 | $5,526 | $42,884 | $6,900 | $35,984 |
| 2022 | $5,255 | $40,508 | $5,060 | $35,448 |
| 2021 | $4,386 | $32,821 | $5,031 | $27,790 |
| 2020 | $4,106 | $30,900 | $5,031 | $25,869 |
| 2019 | $3,914 | $29,498 | $4,025 | $25,473 |
| 2018 | $3,899 | $29,176 | $4,025 | $25,151 |
| 2017 | $3,714 | $27,497 | $4,025 | $23,472 |
| 2016 | $3,625 | $28,026 | $4,025 | $24,001 |
| 2015 | -- | $28,578 | $4,025 | $24,553 |
| 2014 | -- | $30,027 | $4,025 | $26,002 |
Source: Public Records
Map
Nearby Homes
- 3413 Sweetgrass Ct
- 826 N Field Stone Dr
- 3508 Prairie Clover Ct
- 3512 Prairie Clover Ct
- 732 N Blazing Star Dr
- 420 Winnie Way
- 504 N Monterey Way
- 3112 Sherwood Dr
- 406 N Olivia Ave
- Lot 2 Peterson Rd
- 229 Deerfield Ln
- Lot 1 Fall Creek Rd
- Lot 5 Weatherhill Cir
- 3708 Buck Brush Ct
- Lot 6 Weatherhill Cir
- 110 Glenview Dr
- Lot 1 N Running Ridge Rd
- 528 Durham Ct
- 2537 Stowe Dr
- 145 N Fall Creek Dr
- 3503 Sweetgrass Ct
- 3509 Sweetgrass Ct
- 3501 Sweetgrass Ct
- 3511 Sweetgrass Ct
- 3516 Eagle Pass Ct
- 3512 Eagle Pass Ct
- 3513 Sweetgrass Ct
- 3427 Sweetgrass Ct
- 3425 Sweetgrass Ct
- 3515 Sweetgrass Ct
- 3520 Eagle Pass Ct
- 3508 Eagle Pass Ct
- 3504 Sweetgrass Ct
- 3508 Sweetgrass Ct
- 3500 Sweetgrass Ct
- 3423 Sweetgrass Ct
- 3517 Sweetgrass Ct
- 3510 Sweetgrass Ct
- 3512 Sweetgrass Ct
- 3524 Eagle Pass Ct