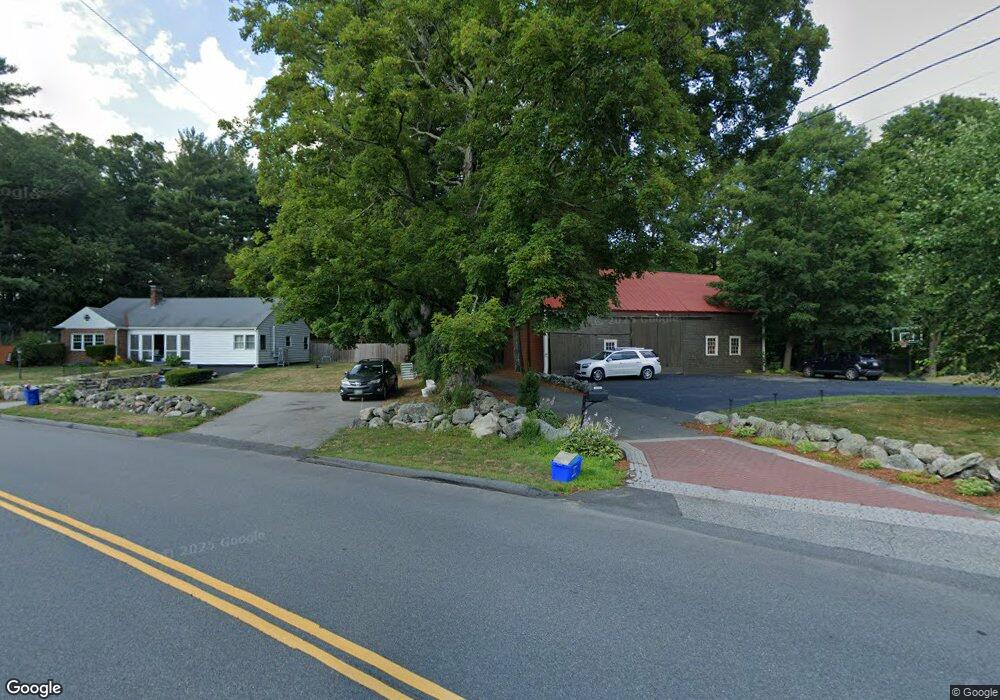
351 Chestnut St Lynnfield, MA 01940
Estimated Value: $1,861,000 - $2,400,000
7
Beds
7
Baths
5,419
Sq Ft
$396/Sq Ft
Est. Value
About This Home
This home is located at 351 Chestnut St, Lynnfield, MA 01940 and is currently estimated at $2,148,213, approximately $396 per square foot. 351 Chestnut St is a home located in Essex County with nearby schools including Lynnfield Middle School, Pickering Middle School, and Lynnfield High School.
Ownership History
Date
Name
Owned For
Owner Type
Purchase Details
Closed on
Aug 8, 1995
Sold by
Est Rourke Robert C and Rourke Robert
Bought by
Marino Frederick W
Current Estimated Value
Home Financials for this Owner
Home Financials are based on the most recent Mortgage that was taken out on this home.
Original Mortgage
$200,000
Interest Rate
7.48%
Mortgage Type
Purchase Money Mortgage
Create a Home Valuation Report for This Property
The Home Valuation Report is an in-depth analysis detailing your home's value as well as a comparison with similar homes in the area
Home Values in the Area
Average Home Value in this Area
Purchase History
| Date | Buyer | Sale Price | Title Company |
|---|---|---|---|
| Marino Frederick W | $269,000 | -- |
Source: Public Records
Mortgage History
| Date | Status | Borrower | Loan Amount |
|---|---|---|---|
| Open | Marino Frederick W | $640,000 | |
| Closed | Marino Frederick W | $650,000 | |
| Closed | Marino Frederick W | $750,000 | |
| Closed | Marino Frederick W | $200,000 |
Source: Public Records
Tax History Compared to Growth
Tax History
| Year | Tax Paid | Tax Assessment Tax Assessment Total Assessment is a certain percentage of the fair market value that is determined by local assessors to be the total taxable value of land and additions on the property. | Land | Improvement |
|---|---|---|---|---|
| 2025 | $20,263 | $1,918,800 | $619,100 | $1,299,700 |
| 2024 | $19,257 | $1,832,300 | $589,600 | $1,242,700 |
| 2023 | $19,115 | $1,691,600 | $589,600 | $1,102,000 |
| 2022 | $18,454 | $1,539,100 | $589,600 | $949,500 |
| 2021 | $17,175 | $1,294,300 | $491,500 | $802,800 |
| 2020 | $17,496 | $1,256,900 | $452,300 | $804,600 |
| 2019 | $16,938 | $1,217,700 | $413,100 | $804,600 |
| 2018 | $16,756 | $1,217,700 | $413,100 | $804,600 |
| 2017 | $16,780 | $1,217,700 | $413,100 | $804,600 |
| 2016 | $16,230 | $1,119,300 | $358,300 | $761,000 |
| 2015 | $16,219 | $1,119,300 | $358,300 | $761,000 |
Source: Public Records
Map
Nearby Homes
- 409 Chestnut St
- 3 Alderney Way
- 5 Alderney Way
- 429 Chestnut St
- 419 Chestnut St
- 8 Needham Rd
- 353 Chestnut St
- 6 Alderney Way
- 4 Alderney Way
- 430 Chestnut St
- 408 Chestnut St
- 420 Chestnut St
- 2 Townsend Rd
- 350 Chestnut St
- 345 Chestnut St
- 345 Chestnut St Unit 345
- 4 Needham Rd
- 450 Chestnut St
- 8 Alderney Way
- 468 Chestnut St