Estimated Value: $262,976 - $361,000
--
Bed
--
Bath
1,500
Sq Ft
$209/Sq Ft
Est. Value
About This Home
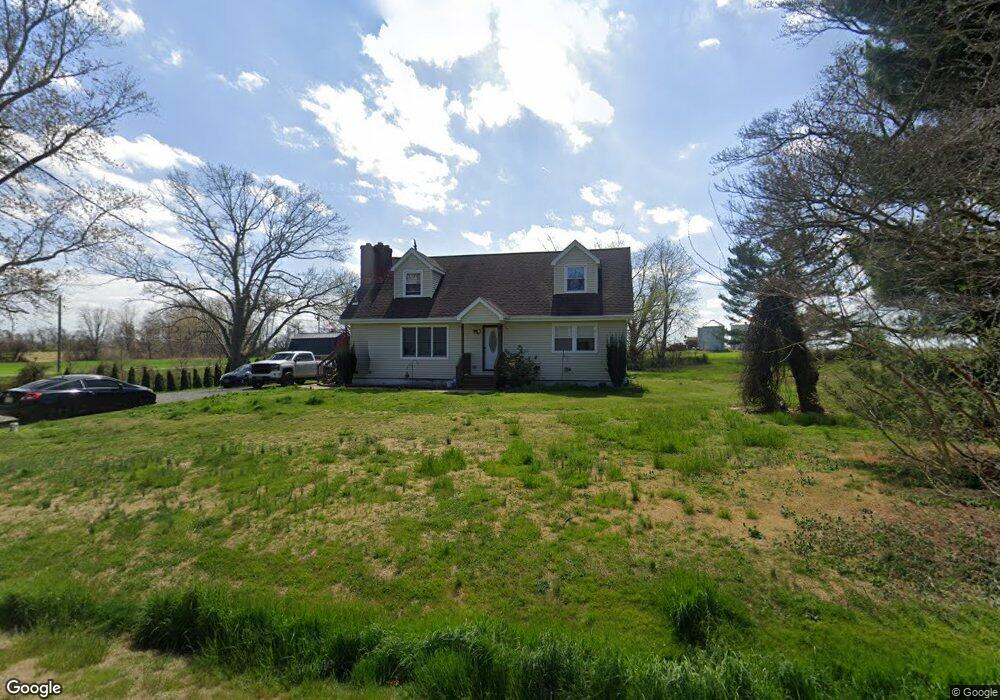
This home is located at 351 Hancocks Bridge Fort e Rd, Salem, NJ 08079 and is currently estimated at $313,994, approximately $209 per square foot. 351 Hancocks Bridge Fort e Rd is a home located in Salem County with nearby schools including Elsinboro Township School.
Ownership History
Date
Name
Owned For
Owner Type
Purchase Details
Closed on
Aug 28, 2024
Sold by
Laspada Frank A and Laspada Jennifer L
Bought by
Laspada Frank A
Current Estimated Value
Purchase Details
Closed on
Jun 15, 2010
Sold by
Sheppard Neal and Sheppard Megan
Bought by
Laspada Frank A and Laspada Jennifer L
Home Financials for this Owner
Home Financials are based on the most recent Mortgage that was taken out on this home.
Original Mortgage
$187,376
Interest Rate
5.25%
Mortgage Type
FHA
Purchase Details
Closed on
Feb 24, 2010
Sold by
Ccts Tax Liens Llc
Bought by
Sheppard 1Lt Neal and Sheppard 1Lt Megan
Purchase Details
Closed on
Oct 29, 2004
Sold by
Cole Joan M
Bought by
Beneficial New Jersey Inc
Create a Home Valuation Report for This Property
The Home Valuation Report is an in-depth analysis detailing your home's value as well as a comparison with similar homes in the area
Home Values in the Area
Average Home Value in this Area
Purchase History
| Date | Buyer | Sale Price | Title Company |
|---|---|---|---|
| Laspada Frank A | -- | None Listed On Document | |
| Laspada Frank A | -- | None Listed On Document | |
| Laspada Frank A | $189,000 | -- | |
| Sheppard 1Lt Neal | $40,000 | -- | |
| Beneficial New Jersey Inc | -- | -- |
Source: Public Records
Mortgage History
| Date | Status | Borrower | Loan Amount |
|---|---|---|---|
| Previous Owner | Laspada Frank A | $187,376 |
Source: Public Records
Tax History Compared to Growth
Tax History
| Year | Tax Paid | Tax Assessment Tax Assessment Total Assessment is a certain percentage of the fair market value that is determined by local assessors to be the total taxable value of land and additions on the property. | Land | Improvement |
|---|---|---|---|---|
| 2025 | $5,279 | $169,200 | $58,400 | $110,800 |
| 2024 | $5,003 | $169,200 | $58,400 | $110,800 |
| 2023 | $5,003 | $169,200 | $58,400 | $110,800 |
| 2022 | $4,878 | $169,200 | $58,400 | $110,800 |
| 2021 | $4,832 | $169,200 | $58,400 | $110,800 |
| 2020 | $4,775 | $169,200 | $58,400 | $110,800 |
| 2019 | $4,707 | $169,200 | $58,400 | $110,800 |
| 2018 | $4,597 | $169,200 | $58,400 | $110,800 |
| 2017 | $4,504 | $169,200 | $58,400 | $110,800 |
| 2016 | $4,340 | $169,200 | $58,400 | $110,800 |
| 2015 | $4,098 | $169,200 | $58,400 | $110,800 |
| 2014 | $3,964 | $169,200 | $58,400 | $110,800 |
Source: Public Records
Map
Nearby Homes
- 44 Delaware Ave
- 148 Amwellbury Rd
- 68 Amwellbury Rd
- 92 Sinnickson Landing Rd
- 251 Chestnut St
- 9 S Tilbury Rd
- 10 Delaware Dr
- 40 Morning Side Dr
- 201 Chestnut St
- 0 Crossland Ave
- 249 Chestnut St
- 197 Pine Ave
- 179 Victory Ave
- 171 Yorke St
- 14 Hillcrest Terrace
- 2 New Bridge Rd Unit C-3
- 75 Hedge St Unit 2 RR
- 217 Smith St
- 304 New Market St
- 61-63 Yorke St
- 351 Hancocks Bridge Fort Rd E
- 351 Fort Elfsborg Rd
- 357 Hancocks Bridge Fort e Rd
- 351 Hancocks Bridge Fort Rd E
- 361 Fort Elfsborg Rd
- 361 Hancocks Bridge Fort Rd E
- 361 Fort Elfsborg Rd
- 361 Hancocks Bridge Fort e Rd
- 362 H Bridge-Ft Elfsborg
- 362 Fort Elfsborg Rd
- 362 Hancocks Bridge Fort e Rd
- 362 Hancocks Bridge Fort e Rd
- 320 Hancocks Bridge Fort e Rd
- 320 Fort Elfsborg Rd
- 318 Fort Elfsborg Rd
- 335 Hancocks Bridge Quinton R
- 436 Salem Fort Elfsborg Rd
- 436 Hancocks Bridge Fort e Rd
- 435 Hancocks Bridge Fort e Rd
- 435 Fort Elfsborg Rd