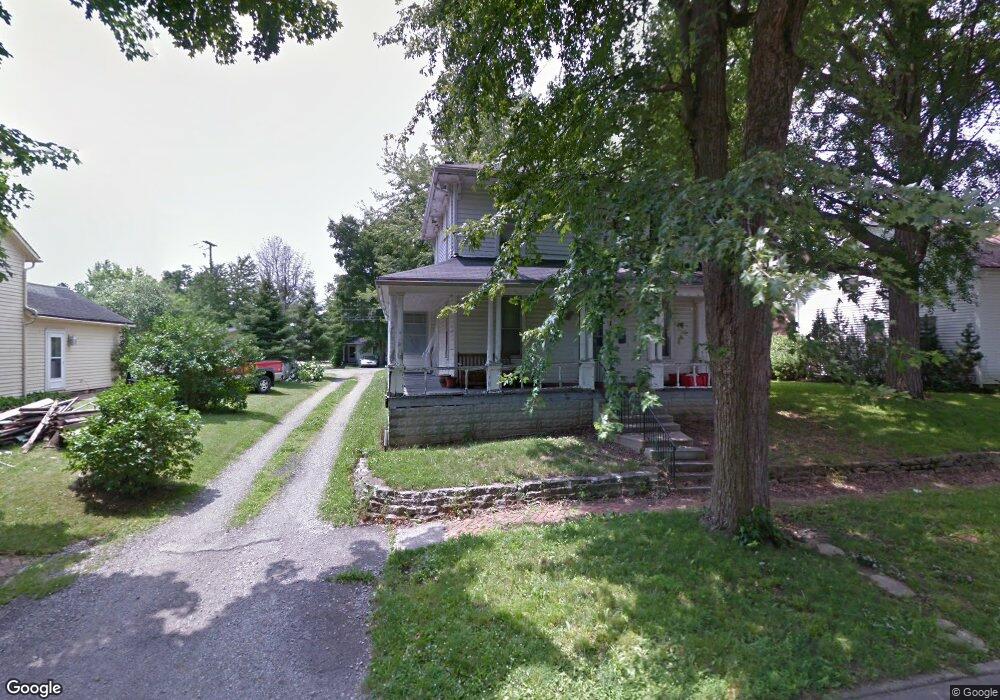
351 N Cherry St Kenton, OH 43326
Estimated Value: $94,000 - $140,000
4
Beds
2
Baths
1,879
Sq Ft
$62/Sq Ft
Est. Value
About This Home
This home is located at 351 N Cherry St, Kenton, OH 43326 and is currently estimated at $116,762, approximately $62 per square foot. 351 N Cherry St is a home located in Hardin County with nearby schools including Kenton Elementary School, Kenton Middle School, and Kenton High School.
Ownership History
Date
Name
Owned For
Owner Type
Purchase Details
Closed on
Jun 16, 2021
Sold by
Teneyck Shanette V and Osborn Shannette V
Bought by
Wolfenbarger Donald I
Current Estimated Value
Purchase Details
Closed on
Dec 2, 1998
Bought by
Osborn Shannette
Purchase Details
Closed on
Dec 7, 1995
Bought by
Osborn Thomas E and Osborn Shanne
Purchase Details
Closed on
Aug 3, 1995
Bought by
Ward John F Le To Alma L
Create a Home Valuation Report for This Property
The Home Valuation Report is an in-depth analysis detailing your home's value as well as a comparison with similar homes in the area
Home Values in the Area
Average Home Value in this Area
Purchase History
| Date | Buyer | Sale Price | Title Company |
|---|---|---|---|
| Wolfenbarger Donald I | -- | None Available | |
| Osborn Shannette | -- | -- | |
| Osborn Thomas E | $35,000 | -- | |
| Ward John F Le To Alma L | -- | -- |
Source: Public Records
Tax History Compared to Growth
Tax History
| Year | Tax Paid | Tax Assessment Tax Assessment Total Assessment is a certain percentage of the fair market value that is determined by local assessors to be the total taxable value of land and additions on the property. | Land | Improvement |
|---|---|---|---|---|
| 2024 | $1,173 | $26,270 | $2,730 | $23,540 |
| 2023 | $1,173 | $26,270 | $2,730 | $23,540 |
| 2022 | $1,108 | $23,270 | $2,040 | $21,230 |
| 2021 | $1,112 | $23,270 | $2,040 | $21,230 |
| 2020 | $1,003 | $23,270 | $2,040 | $21,230 |
| 2019 | $774 | $19,110 | $1,940 | $17,170 |
| 2018 | $866 | $19,110 | $1,940 | $17,170 |
| 2017 | $849 | $19,110 | $1,940 | $17,170 |
| 2016 | $830 | $18,850 | $2,750 | $16,100 |
| 2015 | $679 | $18,850 | $2,750 | $16,100 |
| 2014 | $698 | $18,850 | $2,750 | $16,100 |
| 2013 | $762 | $19,800 | $2,750 | $17,050 |
Source: Public Records
Map
Nearby Homes
- 416 N Cherry St
- 328 N Detroit St
- 0 N Barron St
- 233 N Main St
- 215 N Main St
- 503 Jennings St
- 416 E Eliza St
- 310 N Market St
- 509 E Carrol St
- 219 W Carrol St
- 0 Gilmore St
- 299 Marie Ave
- 121 S High St
- 513 E Franklin St
- 39 Grape St
- 416 Center St
- 104 Oak Ln Unit 15
- 424 W Carrol St
- 530 E Franklin St
- 777 Maydoll Dr
- 343 N Cherry St
- 359 N Cherry St
- 342 N Cherry St
- 339 N Cherry St
- 365 N Cherry St
- 368 N Cherry St
- 216 Summit St
- 338 N Cherry St Unit 338 1/2
- 333 N Cherry St
- 356 N Cherry St
- 212 Summit St
- 348 N Wayne St Unit 350
- 360 N Wayne St
- 358 N Wayne St
- 360 N Cherry St
- 360 N Cherry St
- 334 N Cherry St
- 206 Summit St
- 402 N Cherry St