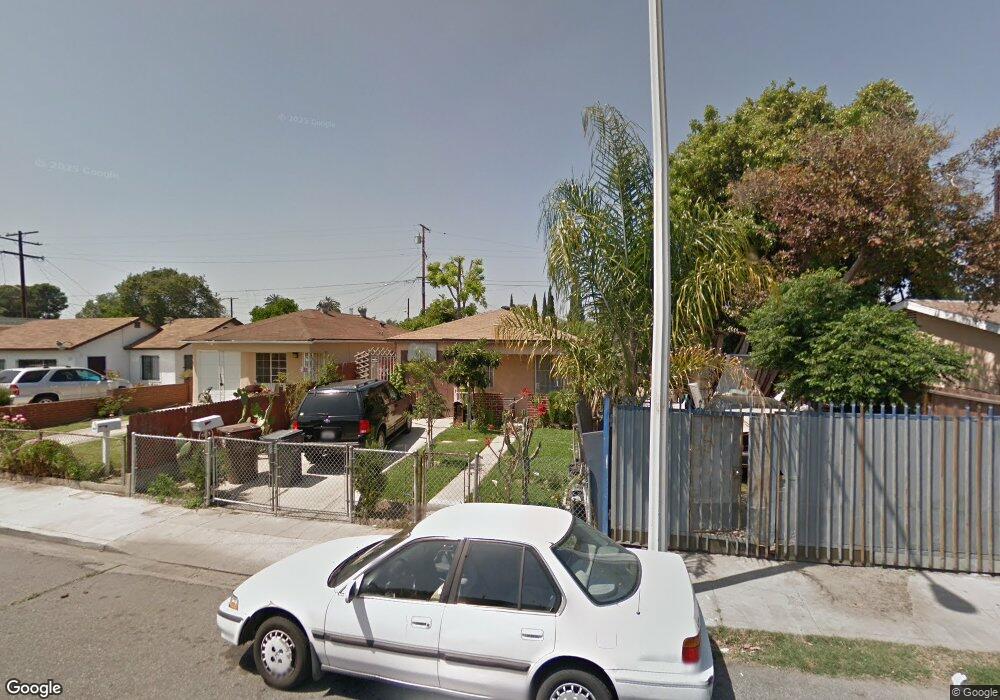
351 W Fig St Compton, CA 90222
Estimated Value: $445,367 - $512,000
2
Beds
1
Bath
585
Sq Ft
$804/Sq Ft
Est. Value
About This Home
This home is located at 351 W Fig St, Compton, CA 90222 and is currently estimated at $470,092, approximately $803 per square foot. 351 W Fig St is a home located in Los Angeles County with nearby schools including Rosecrans Elementary School, Benjamin O. Davis Middle School, and Compton High School.
Ownership History
Date
Name
Owned For
Owner Type
Purchase Details
Closed on
May 16, 2001
Sold by
Martinez Juan Manuel
Bought by
Gomez Jose Luis and Gomez Cristina
Current Estimated Value
Home Financials for this Owner
Home Financials are based on the most recent Mortgage that was taken out on this home.
Original Mortgage
$88,609
Interest Rate
7.21%
Mortgage Type
FHA
Purchase Details
Closed on
Apr 13, 1999
Sold by
Delrio Jose
Bought by
Martinez Juan Manuel
Home Financials for this Owner
Home Financials are based on the most recent Mortgage that was taken out on this home.
Original Mortgage
$46,500
Interest Rate
6.96%
Purchase Details
Closed on
Oct 30, 1998
Sold by
Watson Frank V
Bought by
Delrio Jose and Delrio Rosalinda
Create a Home Valuation Report for This Property
The Home Valuation Report is an in-depth analysis detailing your home's value as well as a comparison with similar homes in the area
Home Values in the Area
Average Home Value in this Area
Purchase History
| Date | Buyer | Sale Price | Title Company |
|---|---|---|---|
| Gomez Jose Luis | $90,000 | Fidelity National Title | |
| Martinez Juan Manuel | $52,000 | Commonwealth Land Title Co | |
| Delrio Jose | $35,000 | -- |
Source: Public Records
Mortgage History
| Date | Status | Borrower | Loan Amount |
|---|---|---|---|
| Previous Owner | Gomez Jose Luis | $88,609 | |
| Previous Owner | Martinez Juan Manuel | $46,500 | |
| Closed | Martinez Juan Manuel | $4,000 | |
| Closed | Gomez Jose Luis | $4,500 |
Source: Public Records
Tax History
| Year | Tax Paid | Tax Assessment Tax Assessment Total Assessment is a certain percentage of the fair market value that is determined by local assessors to be the total taxable value of land and additions on the property. | Land | Improvement |
|---|---|---|---|---|
| 2025 | $2,806 | $132,934 | $77,103 | $55,831 |
| 2024 | $2,806 | $130,329 | $75,592 | $54,737 |
| 2023 | $2,760 | $127,774 | $74,110 | $53,664 |
| 2022 | $2,300 | $125,269 | $72,657 | $52,612 |
| 2021 | $2,317 | $122,814 | $71,233 | $51,581 |
| 2019 | $2,251 | $119,173 | $69,121 | $50,052 |
| 2018 | $2,166 | $116,837 | $67,766 | $49,071 |
| 2016 | $2,061 | $112,302 | $65,136 | $47,166 |
| 2015 | $1,974 | $110,616 | $64,158 | $46,458 |
| 2014 | $1,942 | $108,450 | $62,902 | $45,548 |
Source: Public Records
Map
Nearby Homes
- 2223 E Oris St
- 348 W Peach St
- 2062 E Hatchway St
- 2310 E Stockwell St
- 2107 E Stockwell St
- 2401 E Hatchway St
- 2102 E Lucien St
- 521 W Cherry St
- 522 W Cherry St
- 418 W Spruce St
- 629 W Plum St
- 905 N Hickory Ave
- 701 W 139th St
- 1608 N Grape Ave
- 13115 S Largo Ave
- 124 W Rosecrans Ave
- 1808 N Grape Ave
- 720 W 137th St
- 1111 N Mulberry St
- 2511 E 131st St
- 353 W Fig St
- 357 W Fig St
- 1725 N Acacia Ave
- 2214 E Oris St
- 2218 E Oris St
- 1729 N Acacia Ave
- 2208 E Oris St
- 361 W Fig St
- 2222 E Oris St
- 2204 E Oris St
- 346 W Fig St
- 2202 E Oris St
- 350 W Fig St Unit B
- 350 W Fig St Unit C
- 350 W Fig St
- 356 W Fig St
- 2228 E Oris St
- 2200 E Oris St
- 227 W Winona St
- 1715 N Acacia Ave
Your Personal Tour Guide
Ask me questions while you tour the home.