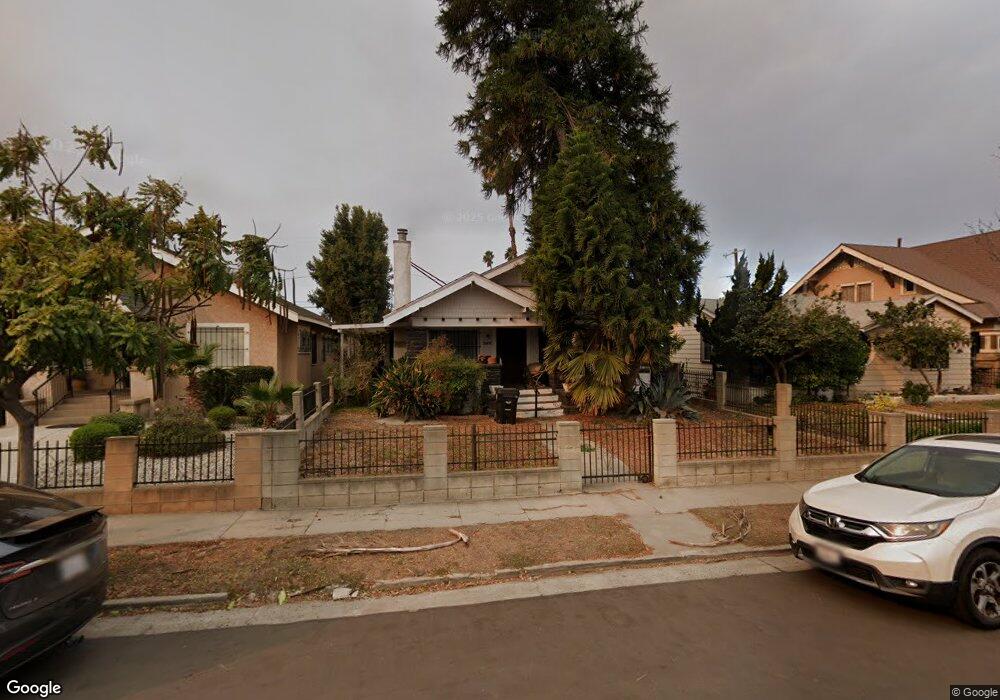
3511 4th Ave Los Angeles, CA 90018
Jefferson Park NeighborhoodEstimated Value: $876,403 - $1,073,000
2
Beds
1
Bath
1,464
Sq Ft
$675/Sq Ft
Est. Value
About This Home
This home is located at 3511 4th Ave, Los Angeles, CA 90018 and is currently estimated at $988,851, approximately $675 per square foot. 3511 4th Ave is a home located in Los Angeles County with nearby schools including Sixth Avenue Elementary School, Audubon Middle School, and Susan Miller Dorsey Senior High School.
Ownership History
Date
Name
Owned For
Owner Type
Purchase Details
Closed on
Dec 28, 1994
Sold by
Brown Danielle B
Bought by
Brown Kevin J
Current Estimated Value
Purchase Details
Closed on
Oct 21, 1994
Sold by
Brown Kevin and Brown Kevin J
Bought by
Morton Rose
Home Financials for this Owner
Home Financials are based on the most recent Mortgage that was taken out on this home.
Original Mortgage
$116,375
Interest Rate
9.27%
Purchase Details
Closed on
Sep 26, 1994
Sold by
Beneficial Mtg Corp
Bought by
Brown Kevin J
Home Financials for this Owner
Home Financials are based on the most recent Mortgage that was taken out on this home.
Original Mortgage
$116,375
Interest Rate
9.27%
Purchase Details
Closed on
Aug 22, 1994
Sold by
Meridia Ruth Z and Beneficial Mtg Corp
Bought by
Beneficial Mtg Corp
Home Financials for this Owner
Home Financials are based on the most recent Mortgage that was taken out on this home.
Original Mortgage
$116,375
Interest Rate
9.27%
Create a Home Valuation Report for This Property
The Home Valuation Report is an in-depth analysis detailing your home's value as well as a comparison with similar homes in the area
Home Values in the Area
Average Home Value in this Area
Purchase History
| Date | Buyer | Sale Price | Title Company |
|---|---|---|---|
| Brown Kevin J | -- | Investors Title Company | |
| Morton Rose | $123,000 | Investors Title Company | |
| Brown Kevin J | -- | Chicago Title Insurance Co | |
| Beneficial Mtg Corp | $28,168 | Benevest Title |
Source: Public Records
Mortgage History
| Date | Status | Borrower | Loan Amount |
|---|---|---|---|
| Previous Owner | Morton Rose | $116,375 |
Source: Public Records
Tax History Compared to Growth
Tax History
| Year | Tax Paid | Tax Assessment Tax Assessment Total Assessment is a certain percentage of the fair market value that is determined by local assessors to be the total taxable value of land and additions on the property. | Land | Improvement |
|---|---|---|---|---|
| 2025 | $2,624 | $205,731 | $164,594 | $41,137 |
| 2024 | $2,624 | $201,698 | $161,367 | $40,331 |
| 2023 | $2,579 | $197,744 | $158,203 | $39,541 |
| 2022 | $2,469 | $193,867 | $155,101 | $38,766 |
| 2021 | $2,428 | $190,066 | $152,060 | $38,006 |
| 2019 | $2,358 | $184,430 | $147,550 | $36,880 |
| 2018 | $2,284 | $180,814 | $144,657 | $36,157 |
| 2016 | $2,171 | $173,795 | $139,041 | $34,754 |
| 2015 | $2,140 | $171,185 | $136,953 | $34,232 |
| 2014 | $2,156 | $167,833 | $134,271 | $33,562 |
Source: Public Records
Map
Nearby Homes