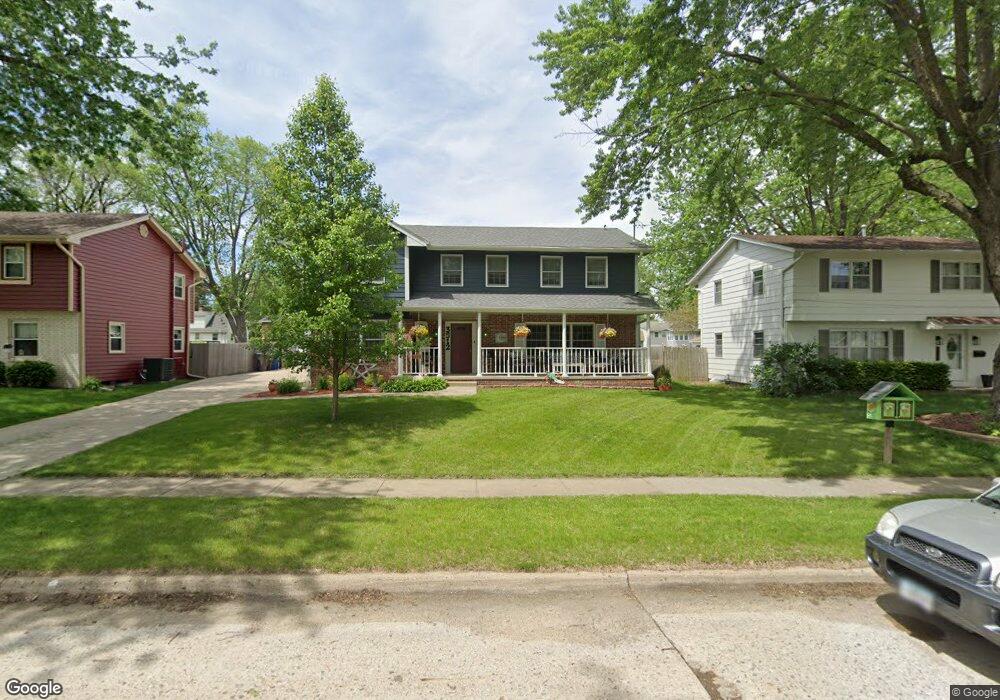
3512 48th Place Des Moines, IA 50310
Beaverdale NeighborhoodEstimated Value: $364,000 - $444,538
4
Beds
2
Baths
2,925
Sq Ft
$139/Sq Ft
Est. Value
About This Home
This home is located at 3512 48th Place, Des Moines, IA 50310 and is currently estimated at $406,885, approximately $139 per square foot. 3512 48th Place is a home located in Polk County with nearby schools including Moore Elementary School, Meredith Middle School, and Hoover High School.
Ownership History
Date
Name
Owned For
Owner Type
Purchase Details
Closed on
Oct 31, 2007
Sold by
C&Rjc Inc
Bought by
Coleman Christopher J and Coleman Marcie L
Current Estimated Value
Create a Home Valuation Report for This Property
The Home Valuation Report is an in-depth analysis detailing your home's value as well as a comparison with similar homes in the area
Home Values in the Area
Average Home Value in this Area
Purchase History
| Date | Buyer | Sale Price | Title Company |
|---|---|---|---|
| Coleman Christopher J | -- | None Available |
Source: Public Records
Tax History Compared to Growth
Tax History
| Year | Tax Paid | Tax Assessment Tax Assessment Total Assessment is a certain percentage of the fair market value that is determined by local assessors to be the total taxable value of land and additions on the property. | Land | Improvement |
|---|---|---|---|---|
| 2025 | $8,524 | $496,500 | $56,900 | $439,600 |
| 2024 | $8,524 | $443,800 | $50,500 | $393,300 |
| 2023 | $8,394 | $443,800 | $50,500 | $393,300 |
| 2022 | $8,328 | $365,000 | $43,900 | $321,100 |
| 2021 | $8,146 | $365,000 | $43,900 | $321,100 |
| 2020 | $6,374 | $335,000 | $40,300 | $294,700 |
| 2019 | $5,648 | $335,000 | $40,300 | $294,700 |
| 2018 | $5,586 | $299,000 | $35,100 | $263,900 |
| 2017 | $5,040 | $299,000 | $35,100 | $263,900 |
| 2016 | $4,906 | $275,200 | $32,000 | $243,200 |
| 2015 | $4,906 | $275,200 | $32,000 | $243,200 |
| 2014 | $6,274 | $244,800 | $28,000 | $216,800 |
Source: Public Records
Map
Nearby Homes