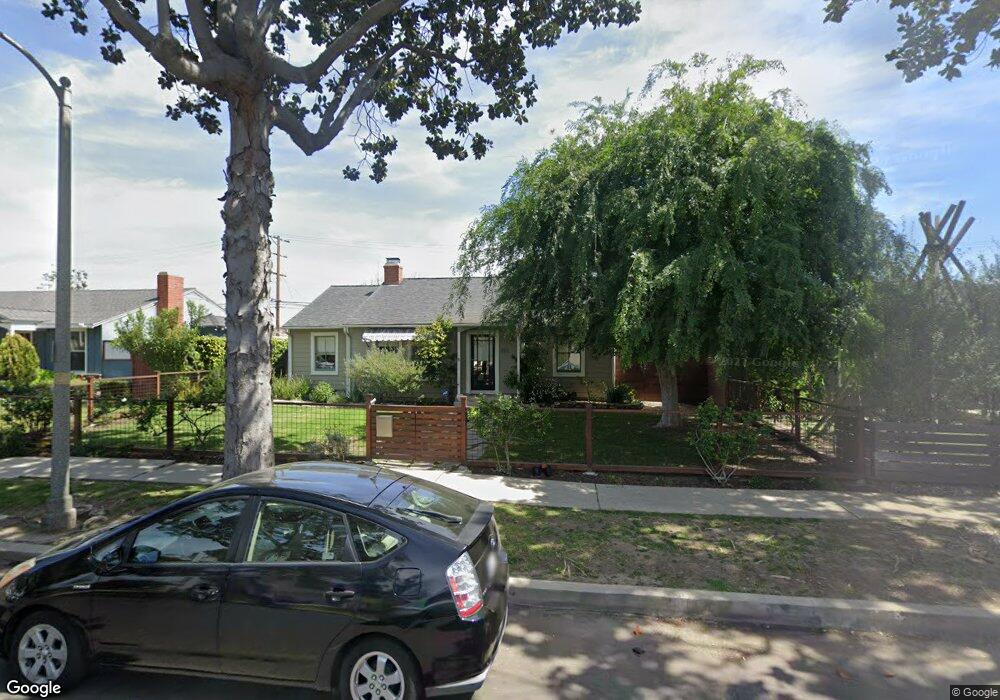
3512 Federal Ave Los Angeles, CA 90066
Mar Vista NeighborhoodEstimated Value: $1,609,000 - $2,320,000
3
Beds
2
Baths
1,600
Sq Ft
$1,260/Sq Ft
Est. Value
About This Home
This home is located at 3512 Federal Ave, Los Angeles, CA 90066 and is currently estimated at $2,016,233, approximately $1,260 per square foot. 3512 Federal Ave is a home located in Los Angeles County with nearby schools including Mar Vista Elementary, Daniel Webster Middle School, and Venice High School.
Ownership History
Date
Name
Owned For
Owner Type
Purchase Details
Closed on
Nov 29, 2001
Sold by
Herring Erick
Bought by
Reynolds Brian H and Desanto Susan E
Current Estimated Value
Home Financials for this Owner
Home Financials are based on the most recent Mortgage that was taken out on this home.
Original Mortgage
$396,000
Outstanding Balance
$154,738
Interest Rate
6.57%
Estimated Equity
$1,861,495
Purchase Details
Closed on
May 11, 2001
Sold by
Trout Charles S
Bought by
Herring Erick and Cohen Susan D
Home Financials for this Owner
Home Financials are based on the most recent Mortgage that was taken out on this home.
Original Mortgage
$465,600
Interest Rate
7%
Purchase Details
Closed on
Apr 30, 1998
Sold by
Grue Douglas
Bought by
Trout Charles S and Trout Michele Velasco
Home Financials for this Owner
Home Financials are based on the most recent Mortgage that was taken out on this home.
Original Mortgage
$296,000
Interest Rate
7.05%
Create a Home Valuation Report for This Property
The Home Valuation Report is an in-depth analysis detailing your home's value as well as a comparison with similar homes in the area
Home Values in the Area
Average Home Value in this Area
Purchase History
| Date | Buyer | Sale Price | Title Company |
|---|---|---|---|
| Reynolds Brian H | $620,000 | Lawyers Title Company | |
| Herring Erick | $582,000 | Continental Title | |
| Trout Charles S | $370,000 | Equity Title Company |
Source: Public Records
Mortgage History
| Date | Status | Borrower | Loan Amount |
|---|---|---|---|
| Open | Reynolds Brian H | $396,000 | |
| Previous Owner | Herring Erick | $465,600 | |
| Previous Owner | Trout Charles S | $296,000 | |
| Closed | Trout Charles S | $37,000 | |
| Closed | Herring Erick | $87,300 | |
| Closed | Reynolds Brian H | $100,000 |
Source: Public Records
Tax History Compared to Growth
Tax History
| Year | Tax Paid | Tax Assessment Tax Assessment Total Assessment is a certain percentage of the fair market value that is determined by local assessors to be the total taxable value of land and additions on the property. | Land | Improvement |
|---|---|---|---|---|
| 2025 | $11,018 | $915,905 | $812,506 | $103,399 |
| 2024 | $11,018 | $897,947 | $796,575 | $101,372 |
| 2023 | $10,808 | $880,341 | $780,956 | $99,385 |
| 2022 | $10,310 | $863,081 | $765,644 | $97,437 |
| 2021 | $10,180 | $846,159 | $750,632 | $95,527 |
| 2019 | $9,875 | $821,064 | $728,369 | $92,695 |
| 2018 | $9,810 | $804,966 | $714,088 | $90,878 |
| 2016 | $9,382 | $773,710 | $686,360 | $87,350 |
| 2015 | $9,244 | $762,089 | $676,051 | $86,038 |
| 2014 | $9,277 | $747,162 | $662,809 | $84,353 |
Source: Public Records
Map
Nearby Homes
- 11702 Charnock Rd
- 3601 Mclaughlin Ave
- 11622 Charnock Rd
- 11523 Vienna Way
- 11957 Modjeska Place
- 3491 Butler Ave
- 11419 Charnock Rd
- 3613 Inglewood Blvd
- 3743 Mclaughlin Ave
- 11931 Lawler St
- 3524 Grand View Blvd
- 11856 Venice Blvd
- 0 Sawtelle Blvd
- 11510 Venice Blvd
- 11286 Westminster Ave Unit 101
- 3667 Sawtelle Blvd
- 11500 Kingsland St
- 3833 Coolidge Ave
- 12028 Venice Blvd
- 3617 Ocean View Ave
- 3506 Federal Ave
- 3518 Federal Ave
- 3500 Federal Ave
- 3524 Federal Ave
- 3513 Mclaughlin Ave
- 3507 Mclaughlin Ave
- 3519 Mclaughlin Ave
- 3513 Federal Ave
- 3519 Federal Ave
- 3501 Mclaughlin Ave
- 3507 Federal Ave
- 3525 Mclaughlin Ave
- 3530 Federal Ave
- 3525 Federal Ave
- 3501 Federal Ave
- 3531 Mclaughlin Ave
- 3496 Federal Ave
- 3536 Federal Ave
- 3531 Federal Ave
- 3537 Mclaughlin Ave