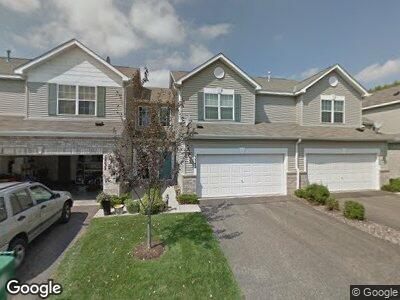
3512 Judd Trail Unit 1702 Stillwater, MN 55082
Estimated Value: $281,000 - $302,512
3
Beds
2
Baths
1,671
Sq Ft
$175/Sq Ft
Est. Value
About This Home
This home is located at 3512 Judd Trail Unit 1702, Stillwater, MN 55082 and is currently estimated at $292,628, approximately $175 per square foot. 3512 Judd Trail Unit 1702 is a home located in Washington County with nearby schools including Rutherford Elementary School, Stillwater Middle School, and Stillwater Area High School.
Ownership History
Date
Name
Owned For
Owner Type
Purchase Details
Closed on
Aug 23, 2022
Sold by
Englund Judy Kathryn
Bought by
Englund Gary Lee
Current Estimated Value
Purchase Details
Closed on
Mar 31, 2021
Sold by
Schroeder Carol S and Schroeder Richard
Bought by
Englund Gary
Home Financials for this Owner
Home Financials are based on the most recent Mortgage that was taken out on this home.
Original Mortgage
$200,000
Interest Rate
2.9%
Mortgage Type
New Conventional
Purchase Details
Closed on
Dec 16, 2015
Sold by
Anderson Evelyn A
Bought by
Schroeder Carol S
Purchase Details
Closed on
May 7, 2015
Sold by
Larson Jeffrey J and Larson Teresa B
Bought by
Anderson Evelyn A
Purchase Details
Closed on
Dec 6, 2002
Sold by
Andrew Jay F and Andrew Deborah L
Bought by
Larson Jeffrey J
Purchase Details
Closed on
Mar 22, 2002
Sold by
The Ryland Group Inc
Bought by
Andrews Jay F and Andrews Deborah L
Create a Home Valuation Report for This Property
The Home Valuation Report is an in-depth analysis detailing your home's value as well as a comparison with similar homes in the area
Home Values in the Area
Average Home Value in this Area
Purchase History
| Date | Buyer | Sale Price | Title Company |
|---|---|---|---|
| Englund Gary Lee | $500 | -- | |
| Englund Gary | $271,000 | Land Title Inc | |
| Schroeder Carol S | -- | None Available | |
| Anderson Evelyn A | $165,000 | Land Title Inc | |
| Larson Jeffrey J | $205,000 | -- | |
| Andrews Jay F | $181,580 | -- | |
| Englund Gary Gary | $271,000 | -- |
Source: Public Records
Mortgage History
| Date | Status | Borrower | Loan Amount |
|---|---|---|---|
| Previous Owner | Englund Gary | $200,000 | |
| Previous Owner | Larson Jeffrey J | $160,550 | |
| Closed | Englund Gary Gary | $268,000 |
Source: Public Records
Tax History Compared to Growth
Tax History
| Year | Tax Paid | Tax Assessment Tax Assessment Total Assessment is a certain percentage of the fair market value that is determined by local assessors to be the total taxable value of land and additions on the property. | Land | Improvement |
|---|---|---|---|---|
| 2023 | $3,606 | $300,000 | $96,000 | $204,000 |
| 2022 | $2,558 | $251,200 | $70,800 | $180,400 |
| 2021 | $2,388 | $221,700 | $62,000 | $159,700 |
| 2020 | $2,422 | $214,000 | $60,000 | $154,000 |
| 2019 | $2,228 | $214,300 | $53,000 | $161,300 |
| 2018 | $2,052 | $189,900 | $43,000 | $146,900 |
| 2017 | $1,954 | $177,500 | $35,000 | $142,500 |
| 2016 | $2,016 | $164,100 | $25,000 | $139,100 |
| 2015 | $1,806 | $132,100 | $17,000 | $115,100 |
| 2013 | -- | $113,400 | $19,700 | $93,700 |
Source: Public Records
Map
Nearby Homes
- 1105 Timber Way
- 1024 Legend Blvd
- 1025 Legend Blvd
- 3145 Ilo Way
- 3190 Ilo Way
- 614 Eben Ct
- 630 Newman Trail
- 3354 Pioneer Place
- 3702 Planting Green
- 7275 Manning Ave N
- TBD Settlers Way
- 237 Rutherford Rd
- 2635 Greenmeadow Ct
- 11647 58th St N
- 27XX Neal Ave N
- XXX Settlers Way
- 12300 Marquess Way N
- 519 Edgewood Ave
- 6720 Lake Elmo Ave N
- 2317 Hidden Valley Ln
- 3512 Judd Trail Unit 1702
- 3522 Judd Trail
- 3502 Judd Trail Unit 1701
- 3532 Judd Trail
- 3542 Judd Trail
- 3552 Judd Trail
- 3562 Judd Trail Unit 1707
- 3572 Judd Trail
- 3501 Judd Trail
- 3511 Judd Trail
- 3561 Judd Trail
- 3551 Judd Trail
- 3571 Judd Trail Unit 1801
- 3531 Judd Trail Unit 1805
- 3521 Judd Trail Unit 1806
- 3541 Judd Trail Unit 1804
- 1103 Bergmann Dr
- 3422 Judd Trail Unit 1903
- 1122 Bergmann Dr
- 1124 Bergmann Dr