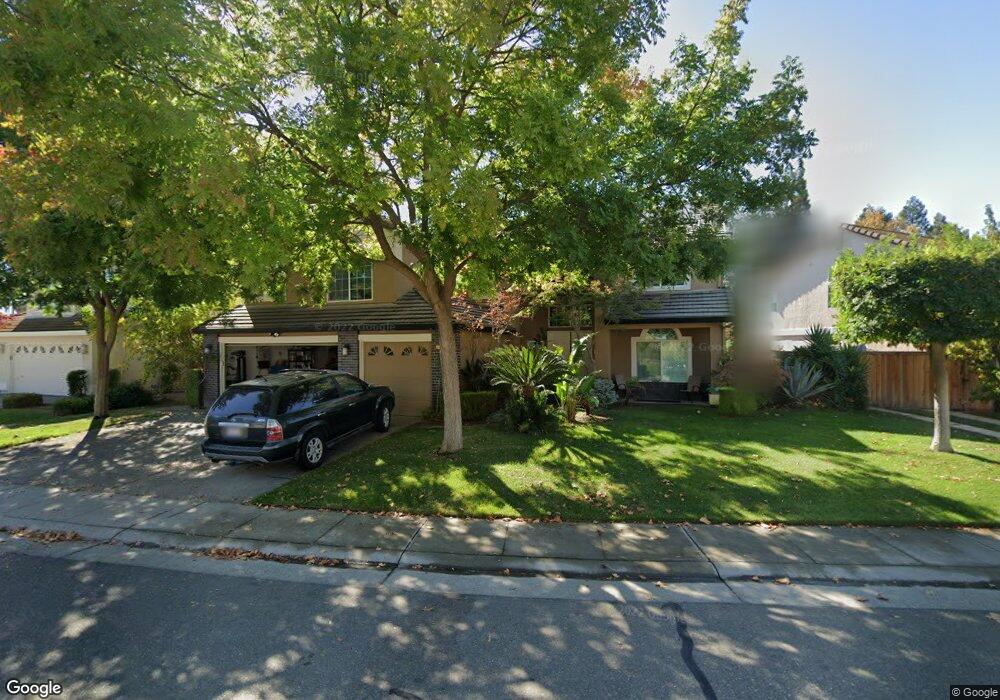
3512 Marsh Creek Way Elk Grove, CA 95758
North West Elk Grove NeighborhoodEstimated Value: $636,000 - $1,050,000
6
Beds
3
Baths
3,951
Sq Ft
$235/Sq Ft
Est. Value
About This Home
This home is located at 3512 Marsh Creek Way, Elk Grove, CA 95758 and is currently estimated at $930,018, approximately $235 per square foot. 3512 Marsh Creek Way is a home located in Sacramento County with nearby schools including Stone Lake Elementary, Toby Johnson Middle School, and Franklin High School.
Ownership History
Date
Name
Owned For
Owner Type
Purchase Details
Closed on
Mar 26, 2014
Sold by
Moreno Mario Del Rio and Moreno Camille
Bought by
Moreno Family Trust
Current Estimated Value
Purchase Details
Closed on
Mar 18, 2003
Sold by
Hight Gerrard and Hight Phyllis M
Bought by
Moreno Mario Del Rio and Moreno Camille
Home Financials for this Owner
Home Financials are based on the most recent Mortgage that was taken out on this home.
Original Mortgage
$370,000
Outstanding Balance
$158,017
Interest Rate
5.79%
Estimated Equity
$772,001
Purchase Details
Closed on
Aug 29, 1997
Sold by
U S Home Corp
Bought by
Hight Gerrard and Hight Phyllis M
Home Financials for this Owner
Home Financials are based on the most recent Mortgage that was taken out on this home.
Original Mortgage
$251,000
Interest Rate
7.42%
Create a Home Valuation Report for This Property
The Home Valuation Report is an in-depth analysis detailing your home's value as well as a comparison with similar homes in the area
Home Values in the Area
Average Home Value in this Area
Purchase History
| Date | Buyer | Sale Price | Title Company |
|---|---|---|---|
| Moreno Family Trust | -- | None Available | |
| Moreno Mario Del Rio | $465,000 | Stewart Title Of Sacramento | |
| Hight Gerrard | $264,500 | Stewart Title |
Source: Public Records
Mortgage History
| Date | Status | Borrower | Loan Amount |
|---|---|---|---|
| Open | Moreno Mario Del Rio | $370,000 | |
| Previous Owner | Hight Gerrard | $251,000 |
Source: Public Records
Tax History Compared to Growth
Tax History
| Year | Tax Paid | Tax Assessment Tax Assessment Total Assessment is a certain percentage of the fair market value that is determined by local assessors to be the total taxable value of land and additions on the property. | Land | Improvement |
|---|---|---|---|---|
| 2025 | $7,865 | $717,988 | $108,613 | $609,375 |
| 2024 | $7,865 | $703,911 | $106,484 | $597,427 |
| 2023 | $7,652 | $690,110 | $104,397 | $585,713 |
| 2022 | $7,519 | $676,579 | $102,350 | $574,229 |
| 2021 | $7,405 | $663,314 | $100,344 | $562,970 |
| 2020 | $7,539 | $656,514 | $99,316 | $557,198 |
| 2019 | $8,016 | $643,642 | $97,369 | $546,273 |
| 2018 | $7,819 | $631,022 | $95,460 | $535,562 |
| 2017 | $7,687 | $618,650 | $93,589 | $525,061 |
| 2016 | $7,345 | $606,520 | $91,754 | $514,766 |
| 2015 | $6,886 | $564,908 | $83,656 | $481,252 |
| 2014 | $6,742 | $548,454 | $81,219 | $467,235 |
Source: Public Records
Map
Nearby Homes
- 3430 Sierra Meadow Ct
- 3619 Lake Terrace Dr
- 3403 Lakeland Way
- 3516 Grimshaw Way
- 9424 Windrunner Ln
- 9608 Crystal Bay Ln
- 3112 W Sondiesa Ct
- 3016 W Sondiesa Ct
- 3810 Benedix Way
- 3401 W Island Ct
- 9567 Diamond Point Ln
- 9349 Edisto Way
- 4410 Bantam Way
- 4414 Bantam Way
- 9588 Castlecave Ct
- 2720 Robinson Creek Ln Unit L
- 9421 Clementine Way
- 9529 Madrid Way
- 9387 Bennoel Way
- 4612 Silvies Way
- 3506 Marsh Creek Way
- 3522 Marsh Creek Way
- 3502 Marsh Creek Way
- 3528 Marsh Creek Way
- 3513 Marsh Creek Way
- 3517 Marsh Creek Way
- 3509 Marsh Creek Way
- 3521 Marsh Creek Way
- 3505 Marsh Creek Way
- 3427 Sierra Meadow Ct
- 3498 Marsh Creek Way
- 3525 Marsh Creek Way
- 3532 Marsh Creek Way
- 3501 Marsh Creek Way
- 3529 Marsh Creek Way
- 3423 Sierra Meadow Ct
- 3604 Lake Terrace Dr
- 3608 Lake Terrace Dr
- 3494 Marsh Creek Way
- 3612 Lake Terrace Dr