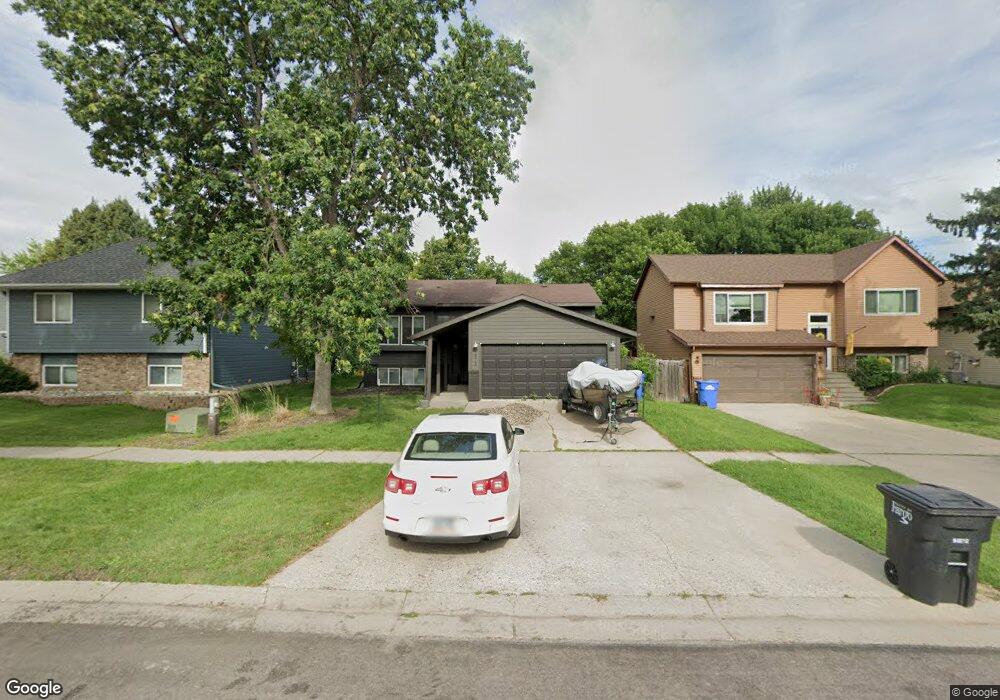
3513 18th St S Fargo, ND 58104
Southpointe NeighborhoodEstimated Value: $293,660 - $307,000
4
Beds
2
Baths
1,920
Sq Ft
$155/Sq Ft
Est. Value
About This Home
This home is located at 3513 18th St S, Fargo, ND 58104 and is currently estimated at $297,915, approximately $155 per square foot. 3513 18th St S is a home located in Cass County with nearby schools including Eagles Elementary School, Discovery Middle School, and Fargo Davies High School.
Ownership History
Date
Name
Owned For
Owner Type
Purchase Details
Closed on
Nov 23, 2018
Sold by
Hegland Tyrel
Bought by
Franklin Kegan R and Franklin Stephanie R
Current Estimated Value
Home Financials for this Owner
Home Financials are based on the most recent Mortgage that was taken out on this home.
Original Mortgage
$198,850
Outstanding Balance
$175,202
Interest Rate
4.9%
Mortgage Type
New Conventional
Estimated Equity
$122,713
Purchase Details
Closed on
Jul 21, 2015
Sold by
Fannie Mae
Bought by
Hegland Tyrel
Home Financials for this Owner
Home Financials are based on the most recent Mortgage that was taken out on this home.
Original Mortgage
$120,000
Interest Rate
3.97%
Mortgage Type
New Conventional
Purchase Details
Closed on
May 22, 2014
Sold by
Madaus Lynn D
Bought by
Federal National Mortgage Association
Create a Home Valuation Report for This Property
The Home Valuation Report is an in-depth analysis detailing your home's value as well as a comparison with similar homes in the area
Home Values in the Area
Average Home Value in this Area
Purchase History
| Date | Buyer | Sale Price | Title Company |
|---|---|---|---|
| Franklin Kegan R | $205,000 | Plains Title Llc | |
| Hegland Tyrel | -- | Grand Forks Abstract & Title | |
| Federal National Mortgage Association | -- | Northern Title Co |
Source: Public Records
Mortgage History
| Date | Status | Borrower | Loan Amount |
|---|---|---|---|
| Open | Franklin Kegan R | $198,850 | |
| Previous Owner | Hegland Tyrel | $120,000 |
Source: Public Records
Tax History Compared to Growth
Tax History
| Year | Tax Paid | Tax Assessment Tax Assessment Total Assessment is a certain percentage of the fair market value that is determined by local assessors to be the total taxable value of land and additions on the property. | Land | Improvement |
|---|---|---|---|---|
| 2024 | $3,540 | $128,500 | $19,650 | $108,850 |
| 2023 | $3,522 | $128,500 | $19,650 | $108,850 |
| 2022 | $3,068 | $109,900 | $19,700 | $90,200 |
| 2021 | $2,747 | $99,900 | $19,700 | $80,200 |
| 2020 | $2,473 | $90,800 | $19,700 | $71,100 |
| 2019 | $2,475 | $90,800 | $11,700 | $79,100 |
| 2018 | $2,444 | $90,800 | $11,700 | $79,100 |
| 2017 | $2,412 | $90,800 | $11,700 | $79,100 |
| 2016 | $1,890 | $76,850 | $11,700 | $65,150 |
| 2015 | $1,834 | $69,850 | $8,000 | $61,850 |
| 2014 | $1,879 | $69,850 | $8,000 | $61,850 |
| 2013 | $1,758 | $67,950 | $8,000 | $59,950 |
Source: Public Records
Map
Nearby Homes