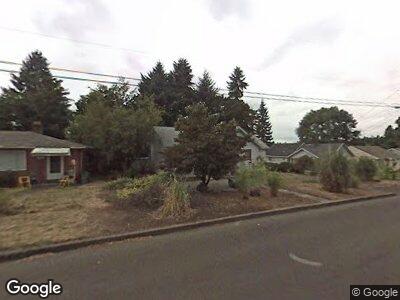
3514 Z St Vancouver, WA 98663
Rose Village NeighborhoodEstimated Value: $361,468 - $377,000
2
Beds
1
Bath
917
Sq Ft
$404/Sq Ft
Est. Value
About This Home
This home is located at 3514 Z St, Vancouver, WA 98663 and is currently estimated at $370,367, approximately $403 per square foot. 3514 Z St is a home located in Clark County with nearby schools including Washington Elementary School, Discovery Middle School, and Hudson's Bay High School.
Ownership History
Date
Name
Owned For
Owner Type
Purchase Details
Closed on
Apr 23, 2025
Sold by
Bersch Daryl W
Bought by
Quickturn Capital Llc
Current Estimated Value
Home Financials for this Owner
Home Financials are based on the most recent Mortgage that was taken out on this home.
Original Mortgage
$278,300
Outstanding Balance
$278,300
Interest Rate
6.65%
Mortgage Type
Construction
Estimated Equity
$92,067
Purchase Details
Closed on
Aug 23, 2000
Sold by
Bersch Daryl W
Bought by
Bersch Daryl W
Create a Home Valuation Report for This Property
The Home Valuation Report is an in-depth analysis detailing your home's value as well as a comparison with similar homes in the area
Home Values in the Area
Average Home Value in this Area
Purchase History
| Date | Buyer | Sale Price | Title Company |
|---|---|---|---|
| Quickturn Capital Llc | $218,476 | Wfg Clark County | |
| Bersch Daryl W | -- | -- |
Source: Public Records
Mortgage History
| Date | Status | Borrower | Loan Amount |
|---|---|---|---|
| Open | Quickturn Capital Llc | $278,300 |
Source: Public Records
Tax History Compared to Growth
Tax History
| Year | Tax Paid | Tax Assessment Tax Assessment Total Assessment is a certain percentage of the fair market value that is determined by local assessors to be the total taxable value of land and additions on the property. | Land | Improvement |
|---|---|---|---|---|
| 2025 | $3,302 | $324,677 | $156,866 | $167,811 |
| 2024 | $3,089 | $337,835 | $156,866 | $180,969 |
| 2023 | $2,973 | $329,868 | $155,475 | $174,393 |
| 2022 | $2,724 | $318,764 | $151,304 | $167,460 |
| 2021 | $2,673 | $272,125 | $129,055 | $143,070 |
| 2020 | $2,405 | $251,757 | $118,785 | $132,972 |
| 2019 | $2,123 | $234,736 | $103,868 | $130,868 |
| 2018 | $2,129 | $214,561 | $0 | $0 |
| 2017 | $1,790 | $178,610 | $0 | $0 |
| 2016 | $1,629 | $156,694 | $0 | $0 |
| 2015 | $1,556 | $136,285 | $0 | $0 |
| 2014 | -- | $123,052 | $0 | $0 |
| 2013 | -- | $108,125 | $0 | $0 |
Source: Public Records
Map
Nearby Homes