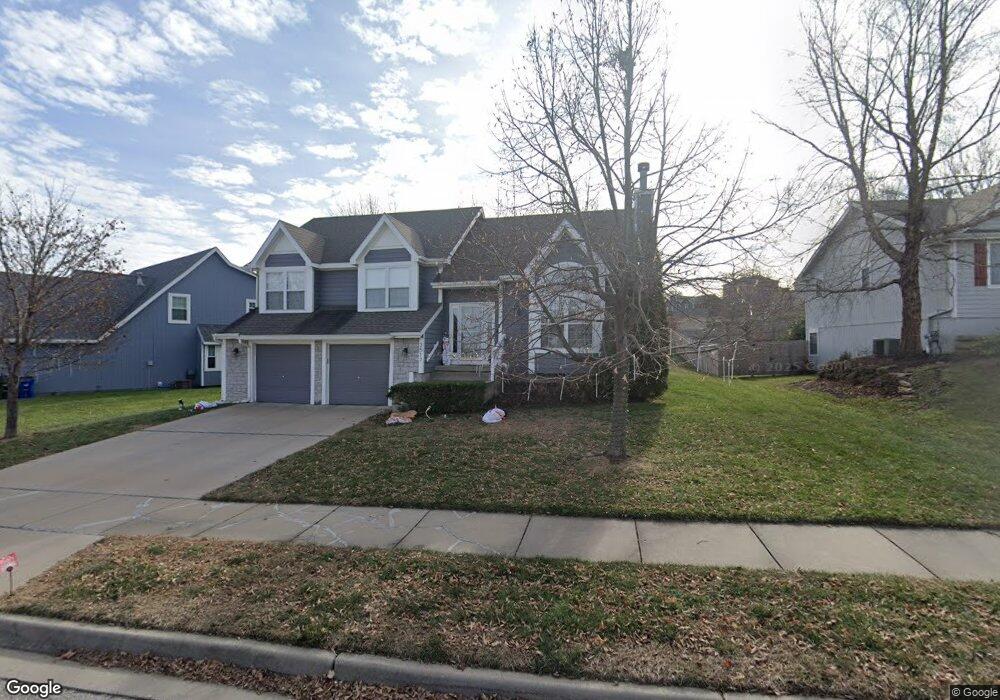
3517 Eagle Pass Ct Lawrence, KS 66049
Estimated Value: $368,737 - $401,000
4
Beds
3
Baths
2,100
Sq Ft
$183/Sq Ft
Est. Value
About This Home
This home is located at 3517 Eagle Pass Ct, Lawrence, KS 66049 and is currently estimated at $383,434, approximately $182 per square foot. 3517 Eagle Pass Ct is a home located in Douglas County with nearby schools including Deerfield Elementary School, West Middle School, and Lawrence Free State High School.
Ownership History
Date
Name
Owned For
Owner Type
Purchase Details
Closed on
Oct 2, 2018
Sold by
Duncan Douglas D and Duncan Kelli R
Bought by
Dye Jason and Dye Rhonda
Current Estimated Value
Home Financials for this Owner
Home Financials are based on the most recent Mortgage that was taken out on this home.
Original Mortgage
$239,900
Outstanding Balance
$208,824
Interest Rate
4.7%
Mortgage Type
VA
Estimated Equity
$174,610
Purchase Details
Closed on
May 3, 2010
Sold by
Primacy Closing Corporation
Bought by
Duncan Douglas D and Duncan Kelli R
Home Financials for this Owner
Home Financials are based on the most recent Mortgage that was taken out on this home.
Original Mortgage
$232,799
Interest Rate
4.91%
Mortgage Type
VA
Purchase Details
Closed on
Jun 18, 2003
Sold by
Trinity Homes Inc
Bought by
Todorovic Vojin and Petrova Ljubica
Home Financials for this Owner
Home Financials are based on the most recent Mortgage that was taken out on this home.
Original Mortgage
$151,100
Interest Rate
4.25%
Mortgage Type
Purchase Money Mortgage
Create a Home Valuation Report for This Property
The Home Valuation Report is an in-depth analysis detailing your home's value as well as a comparison with similar homes in the area
Purchase History
| Date | Buyer | Sale Price | Title Company |
|---|---|---|---|
| Dye Jason | -- | Continental Title | |
| Duncan Douglas D | -- | First American Title | |
| Todorovic Vojin | -- | Commerce Title |
Source: Public Records
Mortgage History
| Date | Status | Borrower | Loan Amount |
|---|---|---|---|
| Open | Dye Jason | $239,900 | |
| Previous Owner | Duncan Douglas D | $232,799 | |
| Previous Owner | Todorovic Vojin | $151,100 |
Source: Public Records
Tax History
| Year | Tax Paid | Tax Assessment Tax Assessment Total Assessment is a certain percentage of the fair market value that is determined by local assessors to be the total taxable value of land and additions on the property. | Land | Improvement |
|---|---|---|---|---|
| 2025 | $5,191 | $41,826 | $7,475 | $34,351 |
| 2024 | $5,142 | $41,423 | $7,475 | $33,948 |
| 2023 | $4,973 | $38,663 | $6,900 | $31,763 |
| 2022 | $4,466 | $34,535 | $6,900 | $27,635 |
| 2021 | $3,975 | $29,774 | $5,980 | $23,794 |
| 2020 | $3,683 | $27,750 | $5,980 | $21,770 |
| 2019 | $3,657 | $27,589 | $5,060 | $22,529 |
| 2018 | $3,451 | $25,864 | $4,600 | $21,264 |
| 2017 | $3,280 | $24,323 | $4,600 | $19,723 |
| 2016 | $3,131 | $24,254 | $4,600 | $19,654 |
| 2015 | $3,202 | $24,794 | $4,600 | $20,194 |
| 2014 | $3,229 | $25,243 | $4,600 | $20,643 |
Source: Public Records
Map
Nearby Homes
- 3508 Prairie Clover Ct
- 3500 Tillerman Dr
- 3503 Firefly Ct
- 826 N Field Stone Dr
- 415 N Daylily Dr
- 420 Winnie Way
- 732 N Blazing Star Dr
- 3702 Tucker Trail
- 406 N Olivia Ave
- Lot 2 Peterson Rd
- 615 N Pennycress Dr
- Lot 1 Fall Creek Rd
- Lot 5 Weatherhill Cir
- 3708 Buck Brush Ct
- Lot 6 Weatherhill Cir
- 110 Glenview Dr
- 220 Deerfield Ln
- Lot 1 N Running Ridge Rd
- 145 N Fall Creek Dr
- 3 Fall Creek Rd
- 3513 Eagle Pass Ct
- 3521 Eagle Pass Ct
- 3422 Stone Post Ct
- 3525 Eagle Pass Ct
- 3509 Eagle Pass Ct
- 3516 Eagle Pass Ct
- 3425 Stone Post Ct
- 3512 Eagle Pass Ct
- 3520 Eagle Pass Ct
- 3524 Eagle Pass Ct
- 3508 Eagle Pass Ct
- 3529 Eagle Pass Ct
- 3418 Stone Post Ct
- 3505 Eagle Pass Ct
- 3528 Eagle Pass Ct
- 3421 Stone Post Ct
- 3501 Eagle Pass Ct
- 3505 Sweetgrass Ct
- 3500 Eagle Pass Ct
- 3509 Sweetgrass Ct
Your Personal Tour Guide
Ask me questions while you tour the home.