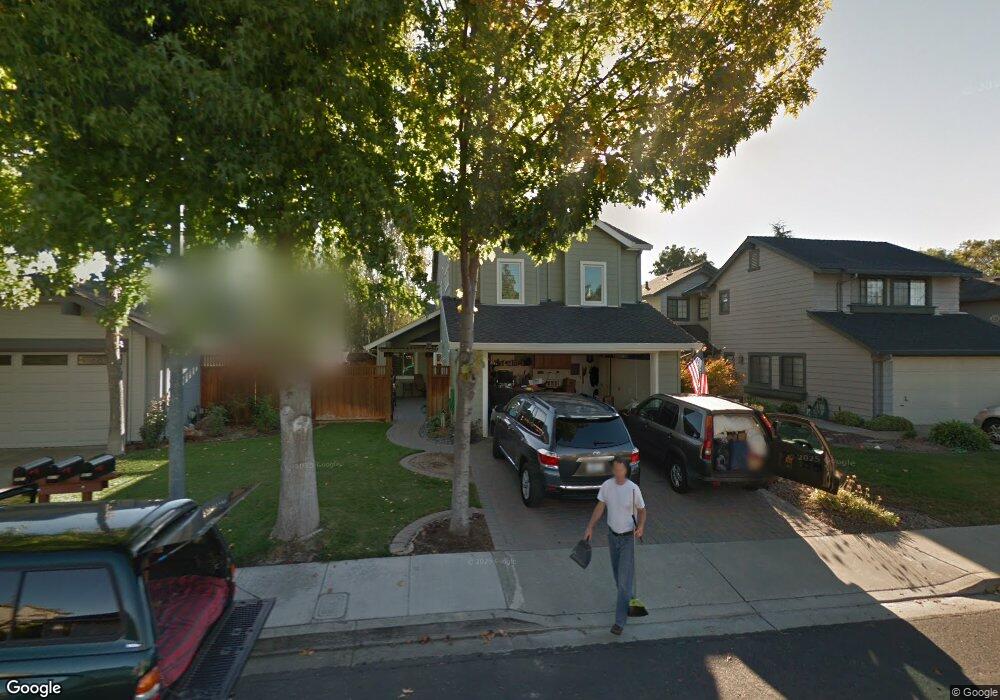
3517 Helen Dr Pleasanton, CA 94588
Amador Valley NeighborhoodEstimated Value: $1,399,000 - $1,740,000
4
Beds
3
Baths
1,950
Sq Ft
$835/Sq Ft
Est. Value
About This Home
This home is located at 3517 Helen Dr, Pleasanton, CA 94588 and is currently estimated at $1,627,605, approximately $834 per square foot. 3517 Helen Dr is a home located in Alameda County with nearby schools including Henry P. Mohr Elementary School, Harvest Park Middle School, and Amador Valley High School.
Ownership History
Date
Name
Owned For
Owner Type
Purchase Details
Closed on
Sep 23, 2019
Sold by
Thompson Greg and Thompson Kathy
Bought by
Ma Congwen and Yan Fei
Current Estimated Value
Home Financials for this Owner
Home Financials are based on the most recent Mortgage that was taken out on this home.
Original Mortgage
$864,000
Outstanding Balance
$747,197
Interest Rate
3%
Mortgage Type
New Conventional
Estimated Equity
$880,408
Purchase Details
Closed on
Sep 6, 2016
Sold by
Thompson Gregory J and Thompson Kathryn E
Bought by
Thompson Greg and Thompson Kathy
Home Financials for this Owner
Home Financials are based on the most recent Mortgage that was taken out on this home.
Original Mortgage
$417,000
Interest Rate
3.43%
Mortgage Type
New Conventional
Purchase Details
Closed on
Jun 25, 2014
Sold by
Thompson Gregory J and Thompson Kathryn E
Bought by
The Thompson Family Trust
Create a Home Valuation Report for This Property
The Home Valuation Report is an in-depth analysis detailing your home's value as well as a comparison with similar homes in the area
Home Values in the Area
Average Home Value in this Area
Purchase History
| Date | Buyer | Sale Price | Title Company |
|---|---|---|---|
| Ma Congwen | $1,080,000 | Fidelity National Title Co | |
| Thompson Greg | -- | Fidelity National Title Co | |
| Thompson Greg | -- | Accommodation | |
| Thompson Gregory J | -- | Fidelity National Title Co | |
| The Thompson Family Trust | -- | None Available |
Source: Public Records
Mortgage History
| Date | Status | Borrower | Loan Amount |
|---|---|---|---|
| Open | Ma Congwen | $864,000 | |
| Previous Owner | Thompson Gregory J | $417,000 |
Source: Public Records
Tax History Compared to Growth
Tax History
| Year | Tax Paid | Tax Assessment Tax Assessment Total Assessment is a certain percentage of the fair market value that is determined by local assessors to be the total taxable value of land and additions on the property. | Land | Improvement |
|---|---|---|---|---|
| 2025 | $13,552 | $1,174,120 | $354,336 | $826,784 |
| 2024 | $13,552 | $1,150,964 | $347,389 | $810,575 |
| 2023 | $13,396 | $1,135,263 | $340,579 | $794,684 |
| 2022 | $12,689 | $1,106,004 | $333,901 | $779,103 |
| 2021 | $12,363 | $1,084,188 | $327,356 | $763,832 |
| 2020 | $12,205 | $1,080,000 | $324,000 | $756,000 |
| 2019 | $4,346 | $365,194 | $89,223 | $275,971 |
| 2018 | $4,258 | $358,034 | $87,474 | $270,560 |
| 2017 | $4,151 | $351,015 | $85,759 | $265,256 |
| 2016 | $3,829 | $344,134 | $84,078 | $260,056 |
| 2015 | $3,759 | $338,967 | $82,815 | $256,152 |
| 2014 | $3,825 | $332,328 | $81,193 | $251,135 |
Source: Public Records
Map
Nearby Homes
- 2058 Palmer Dr
- 2229 Delucchi Dr
- 5885 Bruce Dr
- 1817 Sinclair Dr
- 3778 Angus Way
- 1585 Poppybank Ct
- 4380 Diavila Ave
- 2474 Tanager Dr
- 4385 Diavila Ave
- 3958 W Las Positas Blvd
- 4425 Valley Ave
- 3491 Dorset Ct
- 3910 Rockingham Dr
- 4446 Seminole Way Unit 1
- 4374 Valley Ave Unit D1
- 3299 Runnymede Ct
- 3135 Gulfstream St
- 4832 Knox Gate Ct
- 4327 Fairlands Dr
- 3431 Windsor Ct