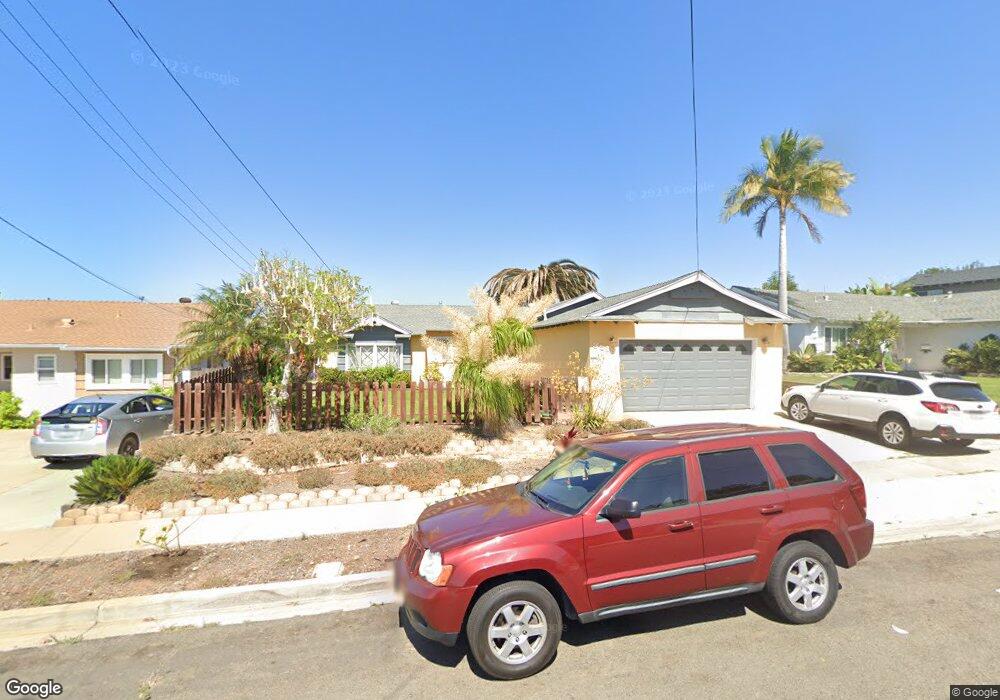
3518 Accomac Ave San Diego, CA 92111
Clairemont Mesa West NeighborhoodEstimated Value: $962,504 - $1,185,000
3
Beds
2
Baths
1,165
Sq Ft
$938/Sq Ft
Est. Value
About This Home
This home is located at 3518 Accomac Ave, San Diego, CA 92111 and is currently estimated at $1,092,876, approximately $938 per square foot. 3518 Accomac Ave is a home located in San Diego County with nearby schools including Holmes Elementary, Marston Middle School, and Clairemont High School.
Ownership History
Date
Name
Owned For
Owner Type
Purchase Details
Closed on
Nov 27, 2002
Sold by
Daleo Jeannine and Daleo Paul
Bought by
Daleo Paul and Daleo Jeannine
Current Estimated Value
Home Financials for this Owner
Home Financials are based on the most recent Mortgage that was taken out on this home.
Original Mortgage
$244,000
Outstanding Balance
$105,111
Interest Rate
6.28%
Estimated Equity
$987,765
Purchase Details
Closed on
May 3, 2001
Sold by
Wright Steve and Wright Shannon
Bought by
Daleo Paul and Daleo Jeannine
Home Financials for this Owner
Home Financials are based on the most recent Mortgage that was taken out on this home.
Original Mortgage
$245,510
Interest Rate
7.15%
Purchase Details
Closed on
Mar 31, 1997
Sold by
Hornridge Judith A Aka Austin Judith A and Hornridge James R
Bought by
Wright Steve and Wright Shannon M
Home Financials for this Owner
Home Financials are based on the most recent Mortgage that was taken out on this home.
Original Mortgage
$162,300
Interest Rate
7.96%
Mortgage Type
FHA
Create a Home Valuation Report for This Property
The Home Valuation Report is an in-depth analysis detailing your home's value as well as a comparison with similar homes in the area
Home Values in the Area
Average Home Value in this Area
Purchase History
| Date | Buyer | Sale Price | Title Company |
|---|---|---|---|
| Daleo Paul | -- | Fidelity National Title Co | |
| Daleo Paul | $307,000 | First American Title | |
| Wright Steve | $170,500 | Old Republic Title Company |
Source: Public Records
Mortgage History
| Date | Status | Borrower | Loan Amount |
|---|---|---|---|
| Open | Daleo Paul | $244,000 | |
| Closed | Daleo Paul | $245,510 | |
| Previous Owner | Wright Steve | $162,300 |
Source: Public Records
Tax History Compared to Growth
Tax History
| Year | Tax Paid | Tax Assessment Tax Assessment Total Assessment is a certain percentage of the fair market value that is determined by local assessors to be the total taxable value of land and additions on the property. | Land | Improvement |
|---|---|---|---|---|
| 2025 | $5,602 | $462,404 | $325,463 | $136,941 |
| 2024 | $5,602 | $453,338 | $319,082 | $134,256 |
| 2023 | $5,479 | $444,450 | $312,826 | $131,624 |
| 2022 | $5,333 | $435,737 | $306,693 | $129,044 |
| 2021 | $5,297 | $427,194 | $300,680 | $126,514 |
| 2020 | $5,233 | $422,814 | $297,597 | $125,217 |
| 2019 | $5,140 | $414,524 | $291,762 | $122,762 |
| 2018 | $4,806 | $406,397 | $286,042 | $120,355 |
| 2017 | $4,692 | $398,430 | $280,434 | $117,996 |
| 2016 | $4,617 | $390,619 | $274,936 | $115,683 |
| 2015 | $4,549 | $384,753 | $270,807 | $113,946 |
| 2014 | $4,478 | $377,217 | $265,503 | $111,714 |
Source: Public Records
Map
Nearby Homes
- 5581 Mount Acara Dr
- 3516 Old Cobble Rd
- 3581 Mount Abbey Ave
- 3270 W Fox Run Way Unit 2
- 3298 Old Heather Rd
- 3218 Old Bridgeport Way
- 3226 Old Heather Rd
- 3262 Mount Carol Dr
- 3120 Old Bridgeport Way
- 3405 Aveley Place
- 3014 Old Bridgeport Way
- 3047 Old Bridgeport Way
- 3413 Rollsreach Dr
- 3161 Mount Tami Dr
- 3173 Via Arcilla
- 3883 Mount Everest Blvd
- 3942 Mount Acadia Blvd
- 3432 Mount Ariane Dr
- 3855 Mount Blackburn Ave
- 4870 Mount Armour Dr
- 3528 Accomac Ave
- 3508 Accomac Ave
- 5554 Mount Acara Dr
- 5546 Mount Acara Dr
- 5560 Mount Acara Dr
- 3538 Accomac Ave
- 3502 Accomac Ave
- 3519 Accomac Ave
- 5540 Mount Acara Dr
- 3509 Accomac Ave
- 5566 Mount Acara Dr
- 3527 Accomac Ave
- 3548 Accomac Ave
- 3533 Accomac Ave
- 3501 Accomac Ave
- 5536 Mount Acara Dr
- 3520 Mount Aclare Ave
- 5549 Mount Acara Dr
- 3541 Accomac Ave
- 5541 Mount Acara Dr