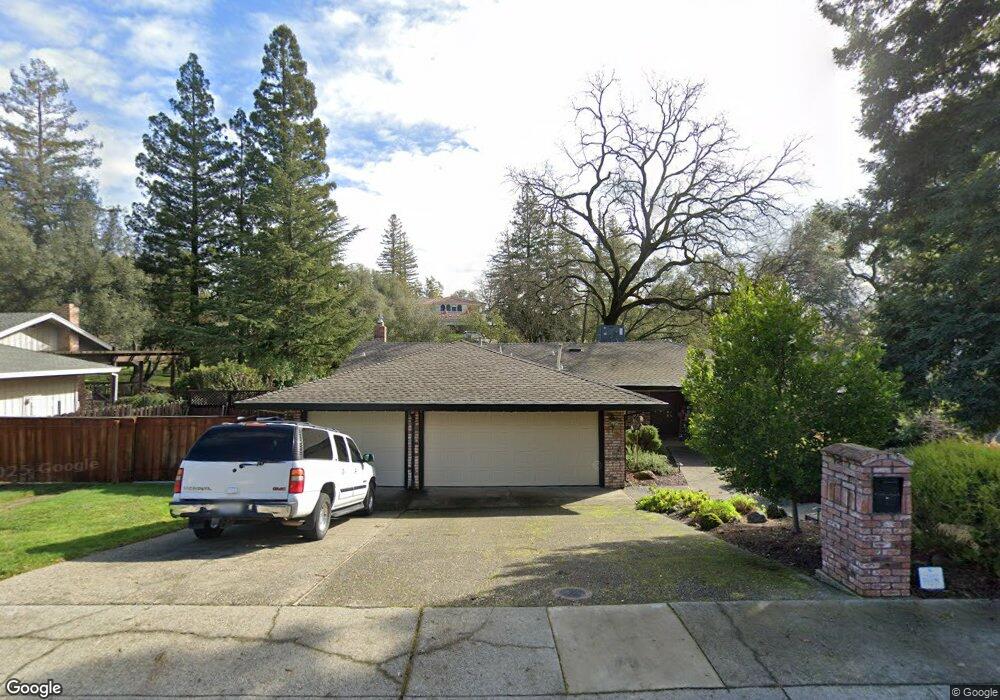
3518 Bluff Ct Carmichael, CA 95608
Estimated Value: $675,000 - $788,000
4
Beds
3
Baths
2,264
Sq Ft
$323/Sq Ft
Est. Value
About This Home
This home is located at 3518 Bluff Ct, Carmichael, CA 95608 and is currently estimated at $730,632, approximately $322 per square foot. 3518 Bluff Ct is a home located in Sacramento County with nearby schools including Carmichael Elementary School, John Barrett Middle School, and Del Campo High School.
Ownership History
Date
Name
Owned For
Owner Type
Purchase Details
Closed on
May 20, 2020
Sold by
Simmons Michael P and Simmons Cheryl R
Bought by
Simmons Michael Paul and Simmons Cheryl Ree
Current Estimated Value
Home Financials for this Owner
Home Financials are based on the most recent Mortgage that was taken out on this home.
Original Mortgage
$299,884
Interest Rate
3.3%
Mortgage Type
VA
Purchase Details
Closed on
Feb 23, 2015
Sold by
Simmons Michael Paul and Simmons Cheryl Ree
Bought by
The Michael Paul Simmons & Cheryl Ree Si
Purchase Details
Closed on
Aug 17, 2012
Sold by
Simmons Michael P and Simmons Cheryl R
Bought by
Simmons Michael P and Simmons Cheryl R
Home Financials for this Owner
Home Financials are based on the most recent Mortgage that was taken out on this home.
Original Mortgage
$353,700
Interest Rate
3.53%
Mortgage Type
VA
Create a Home Valuation Report for This Property
The Home Valuation Report is an in-depth analysis detailing your home's value as well as a comparison with similar homes in the area
Home Values in the Area
Average Home Value in this Area
Purchase History
| Date | Buyer | Sale Price | Title Company |
|---|---|---|---|
| Simmons Michael Paul | -- | Stewart Title | |
| Simmons Michael P | -- | Stewart Title | |
| The Michael Paul Simmons & Cheryl Ree Si | -- | None Available | |
| Simmons Michael P | -- | Pacific Coast Title Company |
Source: Public Records
Mortgage History
| Date | Status | Borrower | Loan Amount |
|---|---|---|---|
| Closed | Simmons Michael P | $299,884 | |
| Closed | Simmons Michael P | $353,700 |
Source: Public Records
Tax History
| Year | Tax Paid | Tax Assessment Tax Assessment Total Assessment is a certain percentage of the fair market value that is determined by local assessors to be the total taxable value of land and additions on the property. | Land | Improvement |
|---|---|---|---|---|
| 2025 | $3,134 | $269,487 | $70,185 | $199,302 |
| 2024 | $3,134 | $264,204 | $68,809 | $195,395 |
| 2023 | $3,076 | $259,024 | $67,460 | $191,564 |
| 2022 | $3,014 | $253,946 | $66,138 | $187,808 |
| 2021 | $2,969 | $248,968 | $64,842 | $184,126 |
| 2020 | $2,913 | $246,417 | $64,178 | $182,239 |
| 2019 | $2,854 | $241,586 | $62,920 | $178,666 |
| 2018 | $2,812 | $236,850 | $61,687 | $175,163 |
| 2017 | $2,791 | $232,207 | $60,478 | $171,729 |
| 2016 | $2,606 | $227,655 | $59,293 | $168,362 |
| 2015 | $2,606 | $224,237 | $58,403 | $165,834 |
| 2014 | $2,551 | $219,845 | $57,259 | $162,586 |
Source: Public Records
Map
Nearby Homes
- 6838 Grant Ave
- 3401 Riverdale Way
- 3414 Marshall Ave
- 3745 Marshall Ave
- 6709 Stanley Ave
- 4009 Fairwood Way
- 4027 Porton Ln
- 4023 Porton Ln
- 4019 Porton Ln
- 4085 Porton Ln
- 4072 Porton Ln
- 4015 Porton Ln
- 4076 Porton Ln
- 4089 Porton Ln
- 4093 Porton Ln
- 4097 Porton Ln
- 8213 Caminata Ln
- 7431 Heidi Ct
- 3901 Park Circle Ln Unit B
- 4112 Alex Ln
Your Personal Tour Guide
Ask me questions while you tour the home.