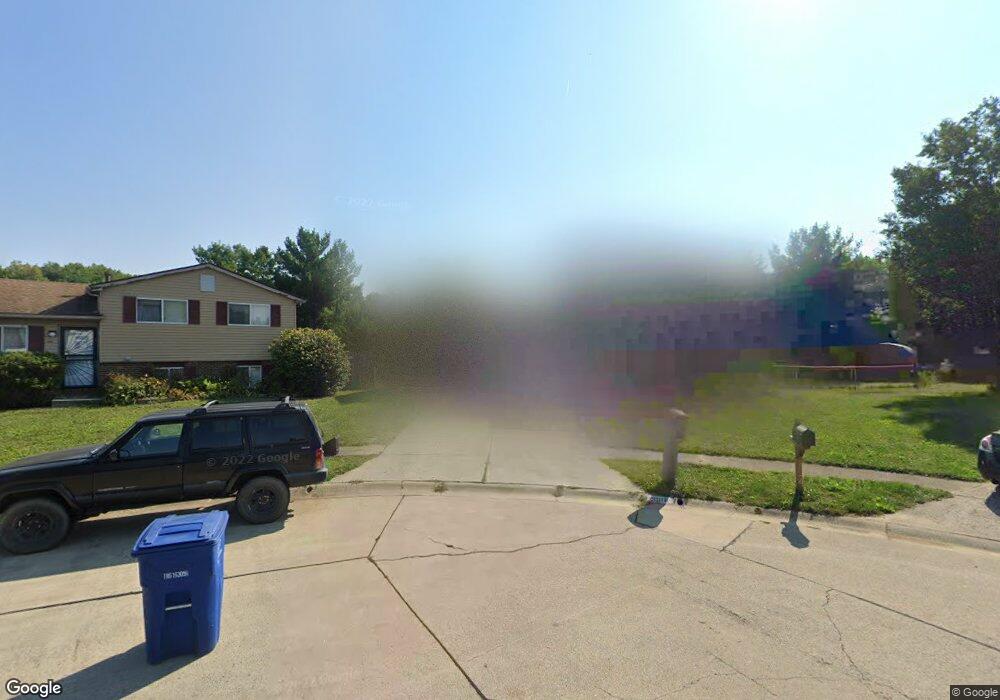
3518 Craigmore Ct Columbus, OH 43231
Parkview NeighborhoodEstimated Value: $271,000 - $312,000
3
Beds
2
Baths
1,220
Sq Ft
$239/Sq Ft
Est. Value
About This Home
This home is located at 3518 Craigmore Ct, Columbus, OH 43231 and is currently estimated at $291,800, approximately $239 per square foot. 3518 Craigmore Ct is a home located in Franklin County with nearby schools including Hawthorne Elementary School, Heritage Middle School, and Westerville South High School.
Ownership History
Date
Name
Owned For
Owner Type
Purchase Details
Closed on
May 2, 2006
Sold by
Chapman Andrew Grey
Bought by
Delbene Chapman Rochelle
Current Estimated Value
Purchase Details
Closed on
Nov 16, 2001
Sold by
Hall James L and Hall Amy D
Bought by
Chapman Andrew Grey and Delbene Chapman Rochelle L
Home Financials for this Owner
Home Financials are based on the most recent Mortgage that was taken out on this home.
Original Mortgage
$108,005
Interest Rate
6.64%
Mortgage Type
FHA
Purchase Details
Closed on
Mar 19, 1999
Sold by
Davis Kathryn
Bought by
Hall James L and Hall Amy D
Home Financials for this Owner
Home Financials are based on the most recent Mortgage that was taken out on this home.
Original Mortgage
$87,000
Interest Rate
6.89%
Purchase Details
Closed on
Jul 3, 1995
Sold by
Dubois Joseph G
Bought by
Kathryn Davis
Home Financials for this Owner
Home Financials are based on the most recent Mortgage that was taken out on this home.
Original Mortgage
$84,650
Interest Rate
7.88%
Mortgage Type
New Conventional
Purchase Details
Closed on
Jan 29, 1992
Purchase Details
Closed on
Nov 2, 1987
Create a Home Valuation Report for This Property
The Home Valuation Report is an in-depth analysis detailing your home's value as well as a comparison with similar homes in the area
Home Values in the Area
Average Home Value in this Area
Purchase History
| Date | Buyer | Sale Price | Title Company |
|---|---|---|---|
| Delbene Chapman Rochelle | -- | None Available | |
| Chapman Andrew Grey | $109,700 | Chicago Title | |
| Hall James L | $97,000 | Transohio Title | |
| Kathryn Davis | $89,150 | -- | |
| -- | $78,700 | -- | |
| -- | $73,100 | -- |
Source: Public Records
Mortgage History
| Date | Status | Borrower | Loan Amount |
|---|---|---|---|
| Previous Owner | Chapman Andrew Grey | $108,005 | |
| Previous Owner | Hall James L | $87,000 | |
| Previous Owner | Kathryn Davis | $84,650 |
Source: Public Records
Tax History Compared to Growth
Tax History
| Year | Tax Paid | Tax Assessment Tax Assessment Total Assessment is a certain percentage of the fair market value that is determined by local assessors to be the total taxable value of land and additions on the property. | Land | Improvement |
|---|---|---|---|---|
| 2024 | $4,451 | $89,320 | $27,300 | $62,020 |
| 2023 | $4,344 | $89,320 | $27,300 | $62,020 |
| 2022 | $3,438 | $53,970 | $11,550 | $42,420 |
| 2021 | $3,472 | $53,970 | $11,550 | $42,420 |
| 2020 | $3,460 | $53,970 | $11,550 | $42,420 |
| 2019 | $3,023 | $44,980 | $9,630 | $35,350 |
| 2018 | $2,954 | $44,980 | $9,630 | $35,350 |
| 2017 | $2,955 | $44,980 | $9,630 | $35,350 |
| 2016 | $2,947 | $40,820 | $7,600 | $33,220 |
| 2015 | $2,954 | $40,820 | $7,600 | $33,220 |
| 2014 | $2,956 | $40,820 | $7,600 | $33,220 |
| 2013 | $1,549 | $42,945 | $7,980 | $34,965 |
Source: Public Records
Map
Nearby Homes
- 4444 Trindel Way
- 3392 Trail Lane Ct
- 3378 Trail Lane Ct
- 3843 Peak Ridge Dr
- 3491 Headford Ct
- 4246 Morsetowne Ct E
- 3854 Deer Knoll Dr
- 4476 Cliff Ridge Dr
- 0 N Stelzer Rd Unit 225041661
- 0 N Stelzer Rd Unit R17 T1 1/4T4
- 3098 Bennington Ave
- 4266 Morsetown Ct
- 4279 Morsetown Ct
- 3577 Frenchpark Dr
- 4169 Commander Ln
- 3010 Bennington Ave
- 4555 Teton Ct
- 4748 Black Sycamore Dr
- 4864 Honeysuckle Blvd
- 0 Blendon Bend Way Unit 225037483
- 3517 Craigmore Ct
- 4439 Trindel Way
- 3512 Craigmore Ct
- 4447 Trindel Way
- 4431 Trindel Way
- 4455 Trindel Way
- 3511 Craigmore Ct
- 3506 Craigmore Ct
- 4425 Trindel Way
- 4463 Trindel Way
- 3505 Craigmore Ct
- 3500 Craigmore Ct
- 3533 Grinnell Dr
- 3499 Craigmore Ct
- 3525 Grinnell Dr
- 4471 Trindel Way
- 3514 Dellwin Ct
- 3522 Dellwin Ct
- 3506 Dellwin Ct
- 3494 Craigmore Ct