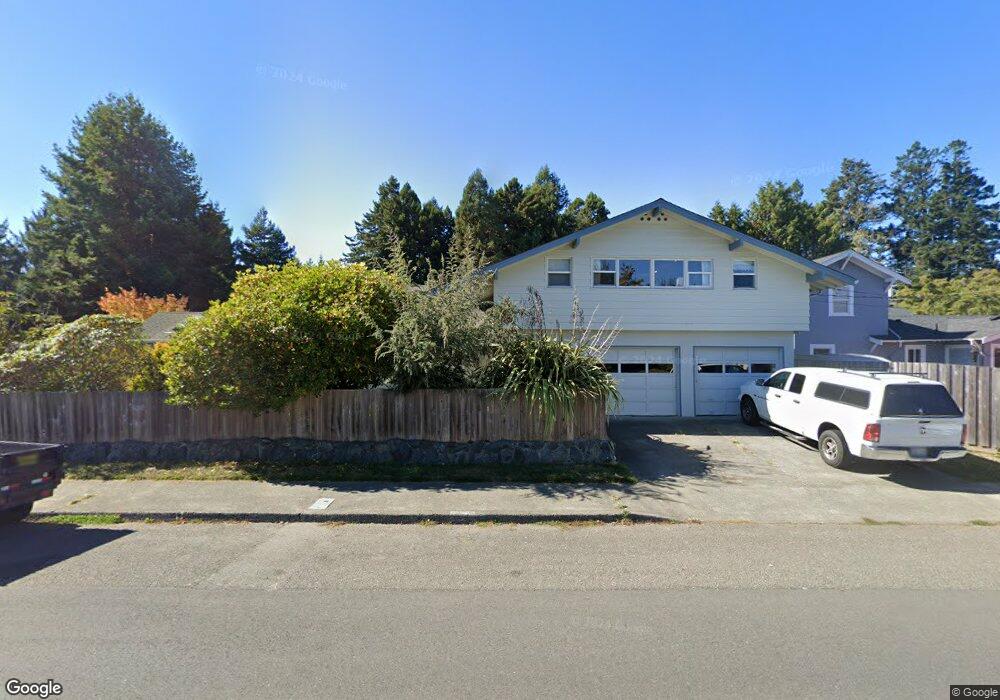
3520 E St Eureka, CA 95503
Rosewood NeighborhoodEstimated Value: $513,000 - $736,000
4
Beds
3
Baths
3,300
Sq Ft
$186/Sq Ft
Est. Value
About This Home
This home is located at 3520 E St, Eureka, CA 95503 and is currently estimated at $613,077, approximately $185 per square foot. 3520 E St is a home located in Humboldt County with nearby schools including Grant Elementary School, Winship Middle School, and Eureka Senior High School.
Ownership History
Date
Name
Owned For
Owner Type
Purchase Details
Closed on
Oct 10, 2014
Sold by
Hall Miriam K
Bought by
Hall Miriam K and The Miriam K Hall Revocable Tr
Current Estimated Value
Purchase Details
Closed on
Aug 12, 1997
Sold by
Carbonneau Pierre G
Bought by
Hall Jack E and Hall Miriam K
Home Financials for this Owner
Home Financials are based on the most recent Mortgage that was taken out on this home.
Original Mortgage
$160,000
Interest Rate
7.44%
Create a Home Valuation Report for This Property
The Home Valuation Report is an in-depth analysis detailing your home's value as well as a comparison with similar homes in the area
Home Values in the Area
Average Home Value in this Area
Purchase History
| Date | Buyer | Sale Price | Title Company |
|---|---|---|---|
| Hall Miriam K | -- | None Available | |
| Hall Jack E | $160,000 | Humboldt Land Title Company |
Source: Public Records
Mortgage History
| Date | Status | Borrower | Loan Amount |
|---|---|---|---|
| Previous Owner | Hall Jack E | $160,000 |
Source: Public Records
Tax History
| Year | Tax Paid | Tax Assessment Tax Assessment Total Assessment is a certain percentage of the fair market value that is determined by local assessors to be the total taxable value of land and additions on the property. | Land | Improvement |
|---|---|---|---|---|
| 2025 | $2,695 | $269,200 | $87,807 | $181,393 |
| 2024 | $2,695 | $263,923 | $86,086 | $177,837 |
| 2023 | $2,656 | $258,749 | $84,399 | $174,350 |
| 2022 | $2,755 | $253,677 | $82,745 | $170,932 |
| 2021 | $2,579 | $248,704 | $81,123 | $167,581 |
| 2020 | $2,559 | $246,155 | $80,292 | $165,863 |
| 2019 | $2,505 | $241,329 | $78,718 | $162,611 |
| 2018 | $2,466 | $236,598 | $77,175 | $159,423 |
| 2017 | $2,452 | $231,960 | $75,662 | $156,298 |
| 2016 | $2,451 | $227,413 | $74,179 | $153,234 |
| 2015 | $2,428 | $223,998 | $73,065 | $150,933 |
| 2014 | $2,269 | $219,611 | $71,634 | $147,977 |
Source: Public Records
Map
Nearby Homes
Your Personal Tour Guide
Ask me questions while you tour the home.