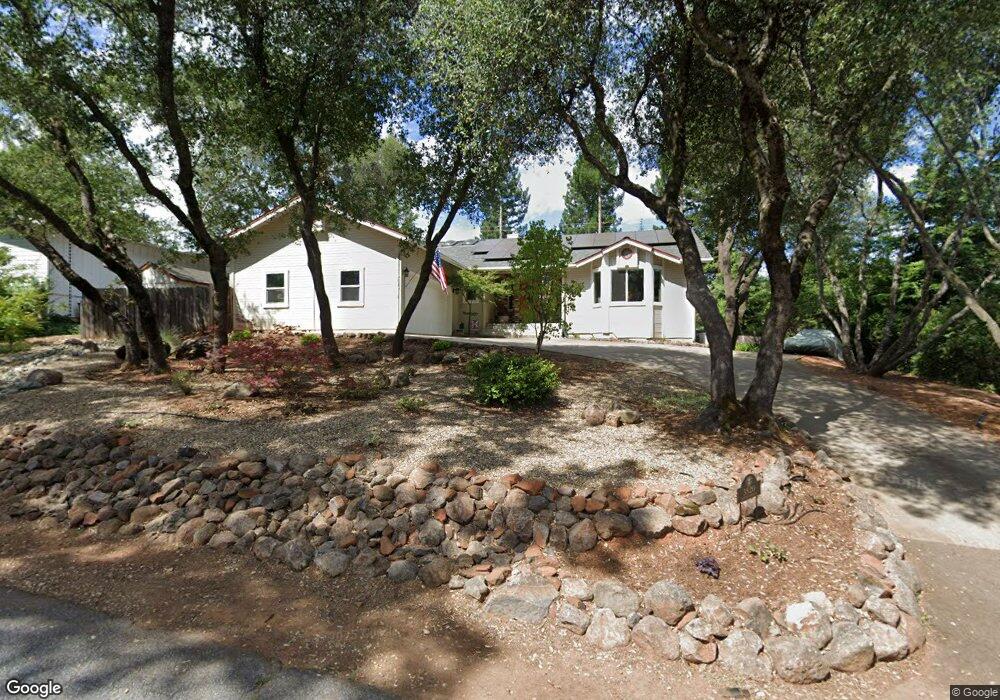
3520 Montclair Rd Cameron Park, CA 95682
Estimated Value: $599,000 - $620,000
3
Beds
2
Baths
2,029
Sq Ft
$300/Sq Ft
Est. Value
About This Home
This home is located at 3520 Montclair Rd, Cameron Park, CA 95682 and is currently estimated at $608,297, approximately $299 per square foot. 3520 Montclair Rd is a home located in El Dorado County with nearby schools including Camerado Springs Middle School, Ponderosa High School, and Montessori Manor.
Ownership History
Date
Name
Owned For
Owner Type
Purchase Details
Closed on
Apr 13, 2015
Sold by
Goudberg Catherine
Bought by
Goudberg Family Trust
Current Estimated Value
Purchase Details
Closed on
Jan 25, 2012
Sold by
Goudberg Johan Robert Paul
Bought by
Goudberg Catherine
Home Financials for this Owner
Home Financials are based on the most recent Mortgage that was taken out on this home.
Original Mortgage
$202,000
Interest Rate
3.85%
Mortgage Type
New Conventional
Purchase Details
Closed on
Mar 5, 1996
Sold by
Kearney John and Kearney Mary Stone
Bought by
Parsons Catherine D
Home Financials for this Owner
Home Financials are based on the most recent Mortgage that was taken out on this home.
Original Mortgage
$133,400
Interest Rate
7.41%
Mortgage Type
Balloon
Create a Home Valuation Report for This Property
The Home Valuation Report is an in-depth analysis detailing your home's value as well as a comparison with similar homes in the area
Home Values in the Area
Average Home Value in this Area
Purchase History
| Date | Buyer | Sale Price | Title Company |
|---|---|---|---|
| Goudberg Family Trust | -- | None Available | |
| Goudberg Catherine | -- | Placer Title Company | |
| Parsons Catherine D | $178,000 | Fidelity National Title |
Source: Public Records
Mortgage History
| Date | Status | Borrower | Loan Amount |
|---|---|---|---|
| Previous Owner | Goudberg Catherine | $202,000 | |
| Previous Owner | Parsons Catherine D | $133,400 |
Source: Public Records
Tax History
| Year | Tax Paid | Tax Assessment Tax Assessment Total Assessment is a certain percentage of the fair market value that is determined by local assessors to be the total taxable value of land and additions on the property. | Land | Improvement |
|---|---|---|---|---|
| 2025 | $3,260 | $310,950 | $76,228 | $234,722 |
| 2024 | $3,260 | $304,854 | $74,734 | $230,120 |
| 2023 | $3,198 | $298,877 | $73,269 | $225,608 |
| 2022 | $3,151 | $293,018 | $71,833 | $221,185 |
| 2021 | $3,110 | $287,274 | $70,425 | $216,849 |
| 2020 | $3,068 | $284,329 | $69,703 | $214,626 |
| 2019 | $3,016 | $278,755 | $68,337 | $210,418 |
| 2018 | $2,937 | $273,291 | $66,998 | $206,293 |
| 2017 | $2,877 | $267,934 | $65,685 | $202,249 |
| 2016 | $2,842 | $262,682 | $64,398 | $198,284 |
| 2015 | $2,800 | $258,738 | $63,432 | $195,306 |
| 2014 | $2,758 | $253,672 | $62,191 | $191,481 |
Source: Public Records
Map
Nearby Homes
- 3590 Montclair Rd
- 3379 Cambridge Rd
- 2779 Osborne Rd
- 3505 Fairway Dr
- 3788 Hillsborough Rd
- 2830 Osborne Rd
- 2886 Knollwood Dr
- 3770 Dita Ct
- 3126 Oxford Rd
- 3264 Heights Dr
- 3300 Woodleigh Ln
- 3276 Topaz Ln
- 3276 Heights Dr Unit A
- 3691 Hampton Ln
- 3002 Tri Ln
- 3271 Woodleigh Ln
- 3144 Quad Ln Unit F
- 3937 Rustic Rd
- 3098 Oakwood Rd
- 2960 Pasada Rd
- 3528 Montclair Rd
- 3516 Montclair Rd
- 3784 Montclair Rd
- 3778 Montclair Rd
- 3521 Cambridge Rd
- 3521 Montclair Rd
- 3534 Montclair Rd
- 3770 Montclair Rd
- 3541 Montclair Rd
- 3141 Knollwood Dr
- 3151 Knollwood Dr
- 3542 Montclair Rd
- 3762 Montclair Rd
- 3522 Cambridge Rd
- 3789 Montclair Rd
- 3799 Montclair Rd
- 3550 Montclair Rd
- 3771 Montclair Rd
- 3756 Montclair Rd
- 3491 Cambridge Rd
Your Personal Tour Guide
Ask me questions while you tour the home.