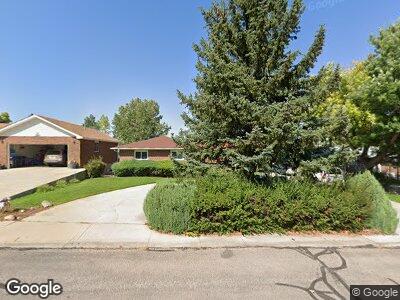
3520 Sunrise Rd Cheyenne, WY 82001
Estimated Value: $391,000 - $425,000
--
Bed
--
Bath
1,576
Sq Ft
$260/Sq Ft
Est. Value
About This Home
This home is located at 3520 Sunrise Rd, Cheyenne, WY 82001 and is currently estimated at $409,245, approximately $259 per square foot. 3520 Sunrise Rd is a home located in Laramie County with nearby schools including Lebhart Elementary School, Fairview Elementary School, and Johnson Junior High School.
Ownership History
Date
Name
Owned For
Owner Type
Purchase Details
Closed on
Aug 25, 2022
Sold by
Schoeler Larry L and Schoeler Etta K
Bought by
Sanders Robert L and Anderson Amanda Kay
Current Estimated Value
Home Financials for this Owner
Home Financials are based on the most recent Mortgage that was taken out on this home.
Original Mortgage
$378,025
Outstanding Balance
$367,169
Interest Rate
5.54%
Mortgage Type
FHA
Purchase Details
Closed on
Aug 27, 2004
Sold by
Fredrichsen Mary E
Bought by
Schoeler Larry L and Jo Etta Schoeler K
Home Financials for this Owner
Home Financials are based on the most recent Mortgage that was taken out on this home.
Original Mortgage
$146,800
Interest Rate
6%
Mortgage Type
Purchase Money Mortgage
Create a Home Valuation Report for This Property
The Home Valuation Report is an in-depth analysis detailing your home's value as well as a comparison with similar homes in the area
Home Values in the Area
Average Home Value in this Area
Purchase History
| Date | Buyer | Sale Price | Title Company |
|---|---|---|---|
| Sanders Robert L | -- | New Title Company Name | |
| Schoeler Larry L | -- | -- |
Source: Public Records
Mortgage History
| Date | Status | Borrower | Loan Amount |
|---|---|---|---|
| Open | Sanders Robert L | $378,025 | |
| Previous Owner | Schoeler Larry L | $38,500 | |
| Previous Owner | Schoeler Larry L | $30,000 | |
| Previous Owner | Schoeler Larry L | $225,000 | |
| Previous Owner | Schoeler Larry L | $43,500 | |
| Previous Owner | Schoeler Larry L | $183,500 | |
| Previous Owner | Schoeler Larry L | $146,800 | |
| Closed | Schoeler Larry L | $36,700 |
Source: Public Records
Tax History Compared to Growth
Tax History
| Year | Tax Paid | Tax Assessment Tax Assessment Total Assessment is a certain percentage of the fair market value that is determined by local assessors to be the total taxable value of land and additions on the property. | Land | Improvement |
|---|---|---|---|---|
| 2024 | $3,216 | $45,482 | $4,686 | $40,796 |
| 2023 | $3,188 | $45,091 | $4,686 | $40,405 |
| 2022 | $3,027 | $41,933 | $4,686 | $37,247 |
| 2021 | $2,709 | $37,448 | $4,686 | $32,762 |
| 2020 | $2,483 | $34,423 | $4,686 | $29,737 |
| 2019 | $2,274 | $31,489 | $4,686 | $26,803 |
| 2018 | $2,062 | $28,835 | $3,690 | $25,145 |
| 2017 | $2,027 | $28,084 | $2,987 | $25,097 |
| 2016 | $1,875 | $25,976 | $2,937 | $23,039 |
| 2015 | $1,697 | $23,501 | $2,937 | $20,564 |
| 2014 | $1,702 | $23,420 | $2,937 | $20,483 |
Source: Public Records
Map
Nearby Homes
- 3408 Arrowhead Rd
- 3228 Boxelder Dr
- 3241 Acacia Dr
- 3108 Silvergate Ct
- 2929 Spruce Dr
- 2762 Spruce Dr
- 3849 E Lincolnway
- 1114 Hot Springs Ave
- 3224 Randy Rd
- 2520 E 11th St
- 2510 E 11th St
- 3429 E 12th St
- 2626 Henderson Dr
- 2414 E 11th St
- 2411 E 12th St
- 2404 E 15th St
- 2400 E 9th St
- 2300 E 16th St
- 3315 Grove Dr
- 1109 Cahill Dr
- 3520 Sunrise Rd
- 3526 Sunrise Rd
- 3514 Sunrise Rd
- 3532 Sunrise Rd
- 3508 Sunrise Rd
- 3419 Sunrise Rd
- 3413 Sunrise Rd
- 3436 Arrowhead Rd
- 3442 Arrowhead Rd
- 3500 Sunrise Rd
- 3538 Sunrise Rd
- 3430 Arrowhead Rd
- 3424 Arrowhead Rd
- 3401 Sunrise Rd
- 3416 Arrowhead Rd
- 1175 Long Valley Rd
- 3604 Sunrise Rd
- 1230 Rosebud Rd
- 3400 Arrowhead Rd
- 2395 Old Faithful Rd