3521 N Maple Ave Fresno, CA 93726
McLane NeighborhoodEstimated Value: $311,000 - $342,000
4
Beds
2
Baths
1,384
Sq Ft
$235/Sq Ft
Est. Value
About This Home
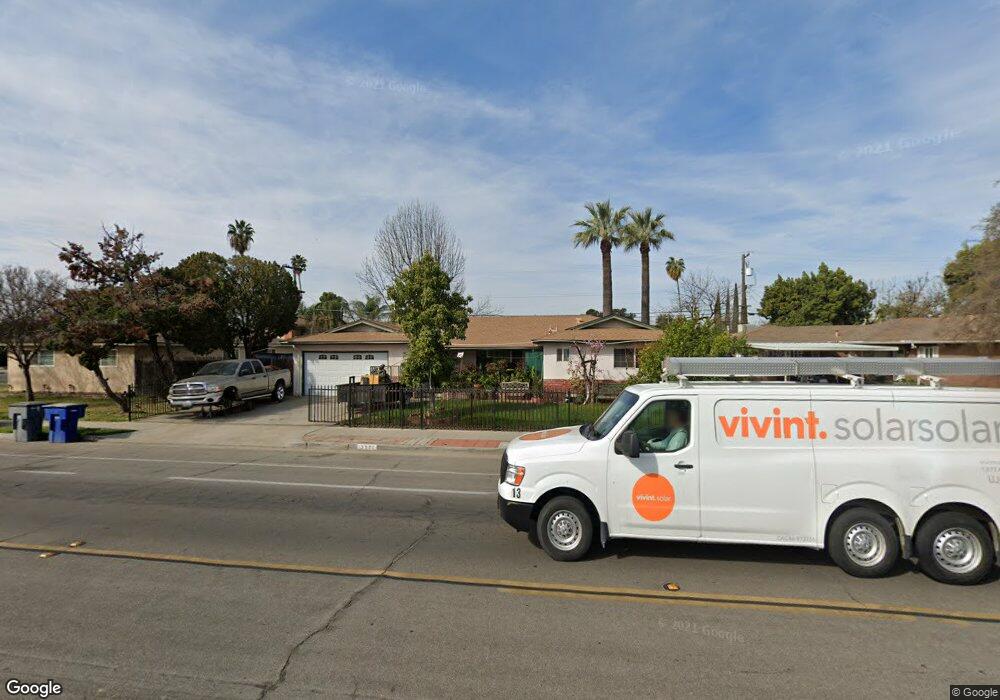
This home is located at 3521 N Maple Ave, Fresno, CA 93726 and is currently estimated at $325,845, approximately $235 per square foot. 3521 N Maple Ave is a home located in Fresno County with nearby schools including Centennial Elementary School, Tioga Middle School, and Herbert Hoover High School.
Ownership History
Date
Name
Owned For
Owner Type
Purchase Details
Closed on
Jan 22, 2014
Sold by
Jimenez Benito
Bought by
Jimenez Benito
Current Estimated Value
Purchase Details
Closed on
Oct 23, 2000
Sold by
Elena Aguilar Maria
Bought by
Jimenez Benito and Jimenez Floria
Home Financials for this Owner
Home Financials are based on the most recent Mortgage that was taken out on this home.
Original Mortgage
$57,440
Outstanding Balance
$20,903
Interest Rate
7.89%
Estimated Equity
$304,942
Purchase Details
Closed on
Sep 15, 1998
Sold by
Hud
Bought by
Aguilar Maria Elena
Home Financials for this Owner
Home Financials are based on the most recent Mortgage that was taken out on this home.
Original Mortgage
$46,550
Interest Rate
8.15%
Purchase Details
Closed on
May 5, 1998
Sold by
Mission Hills Mtg Corp
Bought by
Hud
Purchase Details
Closed on
Sep 23, 1994
Sold by
Belcher Nicole
Bought by
Belcher Larry and Belcher Patricia
Create a Home Valuation Report for This Property
The Home Valuation Report is an in-depth analysis detailing your home's value as well as a comparison with similar homes in the area
Home Values in the Area
Average Home Value in this Area
Purchase History
| Date | Buyer | Sale Price | Title Company |
|---|---|---|---|
| Jimenez Benito | -- | None Available | |
| Jimenez Benito | $72,000 | Fidelity National Title Co | |
| Aguilar Maria Elena | $66,500 | North American Title Co | |
| Hud | -- | Fidelity National Title | |
| Mission Hills Mtg Corp | $90,394 | Fidelity National Title Ins | |
| Belcher Larry | -- | Landmark Title Company |
Source: Public Records
Mortgage History
| Date | Status | Borrower | Loan Amount |
|---|---|---|---|
| Open | Jimenez Benito | $57,440 | |
| Previous Owner | Aguilar Maria Elena | $46,550 |
Source: Public Records
Tax History Compared to Growth
Tax History
| Year | Tax Paid | Tax Assessment Tax Assessment Total Assessment is a certain percentage of the fair market value that is determined by local assessors to be the total taxable value of land and additions on the property. | Land | Improvement |
|---|---|---|---|---|
| 2025 | $1,349 | $106,959 | $36,149 | $70,810 |
| 2023 | $1,323 | $102,808 | $34,747 | $68,061 |
| 2022 | $1,305 | $100,793 | $34,066 | $66,727 |
| 2021 | $1,270 | $98,818 | $33,399 | $65,419 |
| 2020 | $1,264 | $97,806 | $33,057 | $64,749 |
| 2019 | $1,216 | $95,889 | $32,409 | $63,480 |
| 2018 | $1,190 | $94,010 | $31,774 | $62,236 |
| 2017 | $1,170 | $92,167 | $31,151 | $61,016 |
| 2016 | $1,132 | $90,361 | $30,541 | $59,820 |
| 2015 | $1,115 | $89,005 | $30,083 | $58,922 |
| 2014 | $1,094 | $87,262 | $29,494 | $57,768 |
Source: Public Records
Map
Nearby Homes
- 4617 E Garland Ave
- 4704 E Simpson Ave
- 4454 E Simpson Ave
- 4625 E Princeton Ave
- 4674 E Princeton Ave
- 4791 E Simpson Ave
- 4787 E Cornell Ave
- 4002 E Dakota Ave Unit 104
- 3926 E Fountain Way
- 3445 N 9th St
- 4404 E Buckingham Way
- 4747 E Clinton Ave
- 2441 N Chestnut Ave
- 3803 E Shields Ave
- 2243 E Cambridge Ave
- 4597 E Cambridge Ave
- 4641 E Weldon Ave
- 3715 E Garland Ave
- 4022 E Ashlan Ave
- 3646 E Dayton Ave
- 3533 N Maple Ave
- 3509 N Maple Ave
- 3524 N Meridian Ave
- 3514 N Meridian Ave
- 3534 N Meridian Ave
- 3504 N Meridian Ave
- 3544 N Meridian Ave
- 4605 E Cortland Ave
- 3534 N Maple Ave
- 3605 N Maple Ave
- 3435 N Maple Ave
- 4572 E Dayton Ave
- 3606 N Meridian Ave
- 3604 N Maple Ave
- 4582 E Cortland Ave
- 3503 N Meridian Ave
- 4573 E Dayton Ave
- 3617 N Maple Ave
- 4606 E Cortland Ave
- 4576 E Cortland Ave