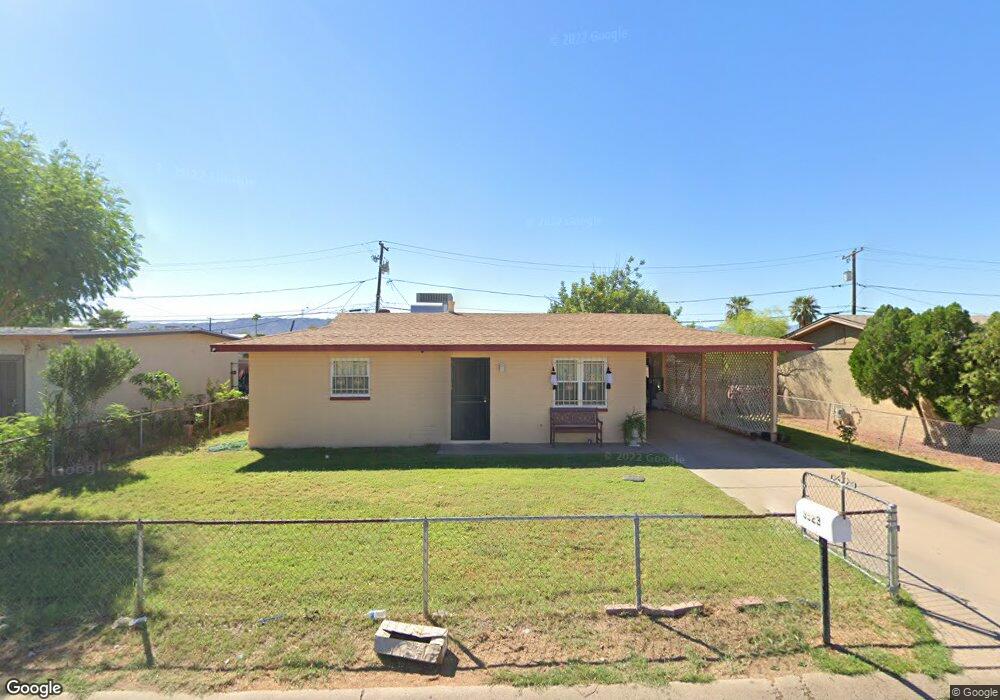
3523 W Grove St Phoenix, AZ 85041
Laveen NeighborhoodEstimated Value: $217,000 - $320,000
1
Bed
1
Bath
804
Sq Ft
$333/Sq Ft
Est. Value
About This Home
This home is located at 3523 W Grove St, Phoenix, AZ 85041 and is currently estimated at $267,429, approximately $332 per square foot. 3523 W Grove St is a home located in Maricopa County with nearby schools including Betty Fairfax High School, Phoenix Coding Academy, and Heritage Academy Laveen.
Ownership History
Date
Name
Owned For
Owner Type
Purchase Details
Closed on
Oct 19, 2018
Sold by
Dvorak Paula and Hatfield Etta
Bought by
Lopez Edgardo and Hernandez Yasmine
Current Estimated Value
Home Financials for this Owner
Home Financials are based on the most recent Mortgage that was taken out on this home.
Original Mortgage
$108,007
Outstanding Balance
$97,513
Interest Rate
6.6%
Mortgage Type
FHA
Estimated Equity
$169,916
Purchase Details
Closed on
Sep 18, 2018
Sold by
Hatfield Bobby Jack
Bought by
Hatfield Etta
Home Financials for this Owner
Home Financials are based on the most recent Mortgage that was taken out on this home.
Original Mortgage
$108,007
Outstanding Balance
$97,513
Interest Rate
6.6%
Mortgage Type
FHA
Estimated Equity
$169,916
Purchase Details
Closed on
Nov 8, 2013
Sold by
Brown Helen B
Bought by
Dvorak Paula L and Hatfield Etta M
Purchase Details
Closed on
Jul 17, 2006
Sold by
Brown Helen B
Bought by
Brown Helen B and Helen B Brown Trust
Create a Home Valuation Report for This Property
The Home Valuation Report is an in-depth analysis detailing your home's value as well as a comparison with similar homes in the area
Home Values in the Area
Average Home Value in this Area
Purchase History
| Date | Buyer | Sale Price | Title Company |
|---|---|---|---|
| Lopez Edgardo | $110,000 | American Title Service Agenc | |
| Hatfield Etta | -- | Accommodation | |
| Dvorak Paula | -- | Accommodation | |
| Dvorak Paula | -- | Accommodation | |
| Dvorak Paula L | -- | None Available | |
| Brown Helen B | -- | None Available |
Source: Public Records
Mortgage History
| Date | Status | Borrower | Loan Amount |
|---|---|---|---|
| Open | Lopez Edgardo | $108,007 |
Source: Public Records
Tax History
| Year | Tax Paid | Tax Assessment Tax Assessment Total Assessment is a certain percentage of the fair market value that is determined by local assessors to be the total taxable value of land and additions on the property. | Land | Improvement |
|---|---|---|---|---|
| 2025 | $448 | $3,161 | -- | -- |
| 2024 | $431 | $3,010 | -- | -- |
| 2023 | $431 | $17,650 | $3,530 | $14,120 |
| 2022 | $418 | $13,350 | $2,670 | $10,680 |
| 2021 | $421 | $11,160 | $2,230 | $8,930 |
| 2020 | $410 | $9,600 | $1,920 | $7,680 |
| 2019 | $411 | $7,460 | $1,490 | $5,970 |
| 2018 | $391 | $5,970 | $1,190 | $4,780 |
| 2017 | $370 | $4,550 | $910 | $3,640 |
| 2016 | $351 | $4,320 | $860 | $3,460 |
| 2015 | $316 | $2,850 | $570 | $2,280 |
Source: Public Records
Map
Nearby Homes
- 5032 S 35th Dr
- 5036 S 36th Ave
- 5022 S 35th Ave
- 3315 W Sunland Ave
- 3410 W T Ryan Ln
- 3233 W Pleasant Ln
- 6314 S 34th Ln
- 3028 W Chanute Pass
- 3927 W Southern Ave
- 5817 S 30th Glen
- 3327 W Leodra Ln
- 3938 W Lynne Ln Unit 1
- 3019 W Jessica Ln
- 3129 W T Ryan Ln
- 3038 W Lynne Ln
- 3232 W Saint Anne Ave
- 5643 S 42nd Ave Unit 51
- 3136 W Saint Catherine Ave
- 5649 S 42nd Ave Unit 50
- 4032 W Nancy Ln
- 3517 W Grove St
- 3527 W Grove St
- 3522 W Chambers St
- 3513 W Grove St
- 3531 W Grove St
- 3518 W Chambers St
- 3532 W Chambers St Unit 9
- 3514 W Chambers St
- 3537 W Grove St Unit 9
- 3507 W Grove St
- 3508 W Chambers St
- 3538 W Chambers St
- 3541 W Grove St
- 3501 W Grove St
- 3542 W Chambers St
- 3523 W Chambers St
- 3502 W Chambers St
- 3519 W Chambers St
- 3529 W Chambers St
- 3515 W Chambers St
Your Personal Tour Guide
Ask me questions while you tour the home.