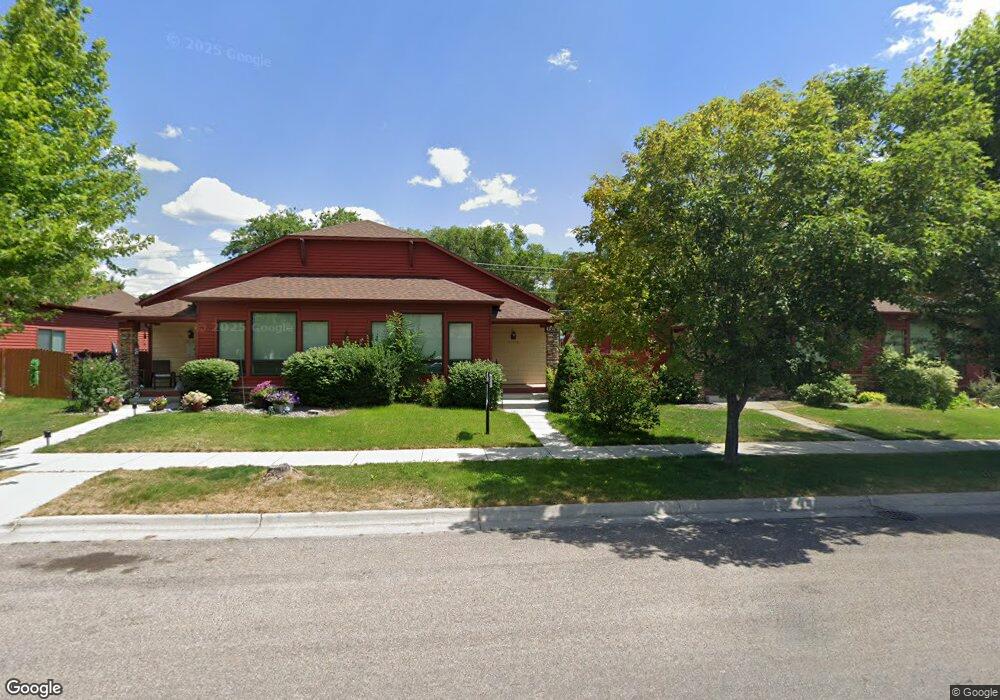
3526 Connery Way Unit B Missoula, MT 59808
Captain John Mullan NeighborhoodEstimated Value: $349,294 - $434,000
2
Beds
2
Baths
1,032
Sq Ft
$385/Sq Ft
Est. Value
About This Home
This home is located at 3526 Connery Way Unit B, Missoula, MT 59808 and is currently estimated at $397,574, approximately $385 per square foot. 3526 Connery Way Unit B is a home located in Missoula County with nearby schools including Hellgate Elementary Lower Grades, Hellgate Middle School, and Big Sky High School.
Ownership History
Date
Name
Owned For
Owner Type
Purchase Details
Closed on
Jun 4, 2018
Sold by
Hoffman Debra L and Clegg Madison L
Bought by
Hoffman Debra L
Current Estimated Value
Purchase Details
Closed on
Feb 4, 2016
Sold by
Hoffman Debra L
Bought by
Hoffman Debra L and Clegg Madison
Home Financials for this Owner
Home Financials are based on the most recent Mortgage that was taken out on this home.
Original Mortgage
$83,498
Outstanding Balance
$35,936
Interest Rate
3.93%
Mortgage Type
New Conventional
Estimated Equity
$361,638
Purchase Details
Closed on
Jan 23, 2012
Sold by
Hoffman Tyler A
Bought by
Hoffman Debra L
Purchase Details
Closed on
Jul 10, 2008
Sold by
Hoffman Debra L
Bought by
Hoffman Debra L and Hoffman Tyler A
Home Financials for this Owner
Home Financials are based on the most recent Mortgage that was taken out on this home.
Original Mortgage
$100,000
Interest Rate
6.04%
Mortgage Type
Purchase Money Mortgage
Create a Home Valuation Report for This Property
The Home Valuation Report is an in-depth analysis detailing your home's value as well as a comparison with similar homes in the area
Home Values in the Area
Average Home Value in this Area
Purchase History
| Date | Buyer | Sale Price | Title Company |
|---|---|---|---|
| Hoffman Debra L | -- | None Available | |
| Hoffman Debra L | -- | Servicelink Crs | |
| Hoffman Debra L | -- | None Available | |
| Hoffman Debra L | -- | Stm | |
| Hoffman Debra L | -- | Stm |
Source: Public Records
Mortgage History
| Date | Status | Borrower | Loan Amount |
|---|---|---|---|
| Open | Hoffman Debra L | $83,498 | |
| Closed | Hoffman Debra L | $100,000 |
Source: Public Records
Tax History Compared to Growth
Tax History
| Year | Tax Paid | Tax Assessment Tax Assessment Total Assessment is a certain percentage of the fair market value that is determined by local assessors to be the total taxable value of land and additions on the property. | Land | Improvement |
|---|---|---|---|---|
| 2025 | $867 | $377,100 | $102,500 | $274,600 |
| 2024 | $1,923 | $321,400 | $85,000 | $236,400 |
| 2023 | $1,881 | $321,400 | $85,000 | $236,400 |
| 2022 | $1,008 | $229,400 | $71,500 | $157,900 |
| 2021 | $830 | $229,400 | $0 | $0 |
| 2020 | $588 | $190,900 | $0 | $0 |
| 2019 | $585 | $190,900 | $0 | $0 |
| 2018 | $619 | $198,800 | $0 | $0 |
| 2017 | $457 | $198,800 | $0 | $0 |
| 2016 | $498 | $162,000 | $0 | $0 |
| 2015 | $479 | $162,000 | $0 | $0 |
| 2014 | $1,006 | $85,807 | $0 | $0 |
Source: Public Records
Map
Nearby Homes
- 3502 A Connery Way Unit A
- 15 Julie Ave
- 3414 Connery Way Unit A
- 3568 Connery Way Unit A
- 3568 Connery Way Unit B
- 3846 Lexington Ave
- 2821 Connery Way
- 3744 Connery Cir Unit A
- 3934 Chelsea Dr
- Tr A Remainder England Blvd
- 3010 Tina Ave Unit 306
- 4002 Melrose Place
- 4030 Camden St Unit A
- 4030 Camden St Unit B
- 2904 Tina Ave Unit 201
- 2610 Sheffield Dr
- 2845 Mary Jane Blvd
- 2905 O'Shaughnesy St Unit 102
- 2905 O'Shaughnesy St Unit 104
- 3089 Sheffield Dr
- 3538 Connery Way Unit A
- 3538 Connery Way Unit B
- 3514 Connery Way Unit B
- 3538B Connery Way
- 3552 Connery Way Unit A
- 3552 Connery Way Unit B
- 19 Julie Ave
- 3502 Connery Way Unit A
- 3502 Connery Way Unit B
- 3552 Connery Way
- 3803 Lancaster Rd
- 17 Julie Ave
- 3802 Lexington Ave
- 3802 Lancaster Rd
- 3811 Lancaster Rd
- 3560 A Connery Way
- 3450B Connery Way
- 3812 Lexington Ave
- 3810 Lancaster Rd
- 3450 A Connery Way