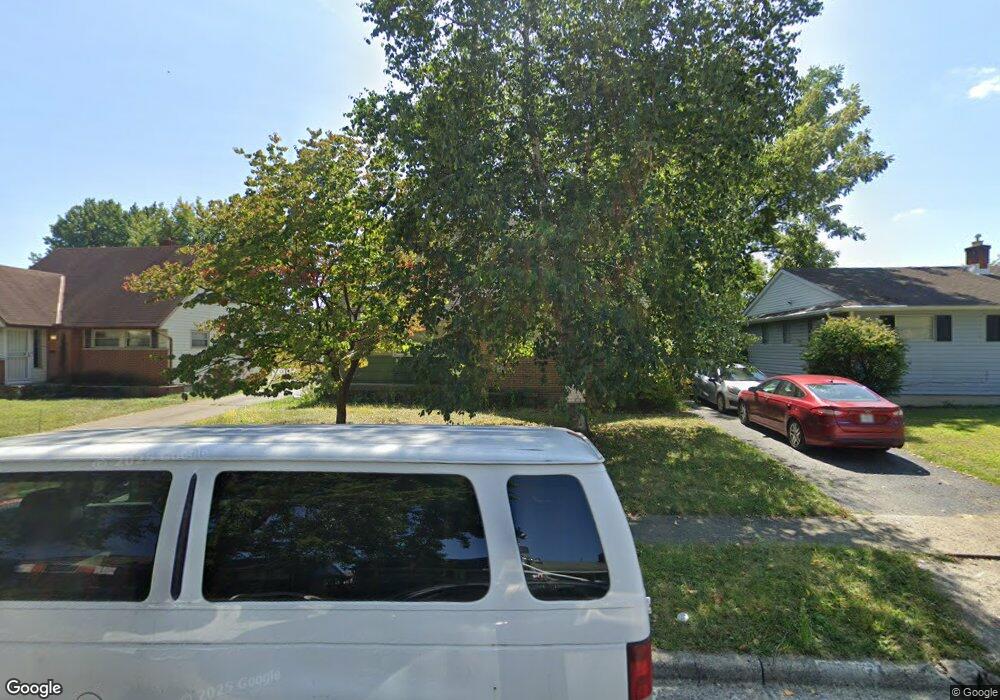
3527 Seabrook Ave Columbus, OH 43227
Linwood NeighborhoodEstimated Value: $210,000 - $264,000
4
Beds
2
Baths
1,832
Sq Ft
$126/Sq Ft
Est. Value
About This Home
This home is located at 3527 Seabrook Ave, Columbus, OH 43227 and is currently estimated at $230,499, approximately $125 per square foot. 3527 Seabrook Ave is a home located in Franklin County with nearby schools including Scottwood Elementary School, Johnson Park Middle School, and Walnut Ridge High School.
Ownership History
Date
Name
Owned For
Owner Type
Purchase Details
Closed on
Feb 12, 2020
Sold by
Lonestar Holdings Llc
Bought by
Vb One Llc
Current Estimated Value
Purchase Details
Closed on
Feb 11, 2020
Sold by
Rozler Michael A
Bought by
Lonestar Holdings Llc
Purchase Details
Closed on
Aug 6, 2007
Sold by
Us Bank Na
Bought by
Rozler Michael A
Purchase Details
Closed on
Apr 30, 2007
Sold by
Skillman Sherrie and Case #06Cve11 14787
Bought by
Us Bank Na and Structured Asset Investment Loan Trust 2
Purchase Details
Closed on
Jun 21, 2002
Sold by
Irish Rose Realty Ltd
Bought by
Skillman Sherrie
Home Financials for this Owner
Home Financials are based on the most recent Mortgage that was taken out on this home.
Original Mortgage
$90,675
Interest Rate
7.95%
Purchase Details
Closed on
Dec 19, 2000
Sold by
Parker R Donald
Bought by
Irish Rose Realty Ltd
Purchase Details
Closed on
Oct 2, 1965
Bought by
Parker R Donald
Create a Home Valuation Report for This Property
The Home Valuation Report is an in-depth analysis detailing your home's value as well as a comparison with similar homes in the area
Home Values in the Area
Average Home Value in this Area
Purchase History
| Date | Buyer | Sale Price | Title Company |
|---|---|---|---|
| Vb One Llc | $85,000 | Total Title Services | |
| Lonestar Holdings Llc | $68,000 | World Class Title | |
| Rozler Michael A | $67,300 | Attorney | |
| Us Bank Na | $74,000 | None Available | |
| Skillman Sherrie | $100,800 | -- | |
| Irish Rose Realty Ltd | $70,000 | -- | |
| Parker R Donald | -- | -- |
Source: Public Records
Mortgage History
| Date | Status | Borrower | Loan Amount |
|---|---|---|---|
| Previous Owner | Skillman Sherrie | $90,675 |
Source: Public Records
Tax History Compared to Growth
Tax History
| Year | Tax Paid | Tax Assessment Tax Assessment Total Assessment is a certain percentage of the fair market value that is determined by local assessors to be the total taxable value of land and additions on the property. | Land | Improvement |
|---|---|---|---|---|
| 2024 | $3,094 | $67,520 | $13,230 | $54,290 |
| 2023 | $3,056 | $67,515 | $13,230 | $54,285 |
| 2022 | $1,997 | $30,530 | $6,900 | $23,630 |
| 2021 | $1,640 | $30,530 | $6,900 | $23,630 |
| 2020 | $1,628 | $30,530 | $6,900 | $23,630 |
| 2019 | $1,569 | $25,240 | $5,740 | $19,500 |
| 2018 | $1,665 | $25,240 | $5,740 | $19,500 |
| 2017 | $1,650 | $25,240 | $5,740 | $19,500 |
| 2016 | $1,936 | $28,500 | $4,940 | $23,560 |
| 2015 | $1,763 | $28,500 | $4,940 | $23,560 |
| 2014 | $1,767 | $28,500 | $4,940 | $23,560 |
| 2013 | $969 | $31,675 | $5,495 | $26,180 |
Source: Public Records
Map
Nearby Homes
- 3566 Seabrook Ave
- 3563 Astor Ave
- 1271 S Weyant Ave
- 3325 E Deshler Ave
- 1664 Barnett Rd
- 3598 Astor Ave
- 3246 E Deshler Ave
- 1252 Carolwood Ave
- 1294 Dellwood Ave
- 1624 Miltwood Rd
- 3325 Towers Ct S
- 1836 Penfield Ct S
- 3339 Towers Ct N
- 1254 Elderwood Ave
- 3861 Gilroy Rd
- 3084 Clermont Rd
- 931 E Fulton St
- 1721 Bostwick Rd
- 1220 Elderwood Ave
- 1656 Vilardo Ln
- 3519 Seabrook Ave
- 3533 Seabrook Ave
- 3520 Kirkwood Rd
- 3541 Seabrook Ave
- 3511 Seabrook Ave
- 3528 Kirkwood Rd
- 3512 Kirkwood Rd
- 3506 Kirkwood Rd
- 3534 Kirkwood Rd
- 3528 Seabrook Ave
- 3534 Seabrook Ave
- 3549 Seabrook Ave
- 3503 Seabrook Ave
- 3520 Seabrook Ave
- 358 Kirkwood Rd
- 3542 Seabrook Ave
- 3514 Seabrook Ave
- 3498 Kirkwood Rd
- 3542 Kirkwood Rd
- 3550 Seabrook Ave