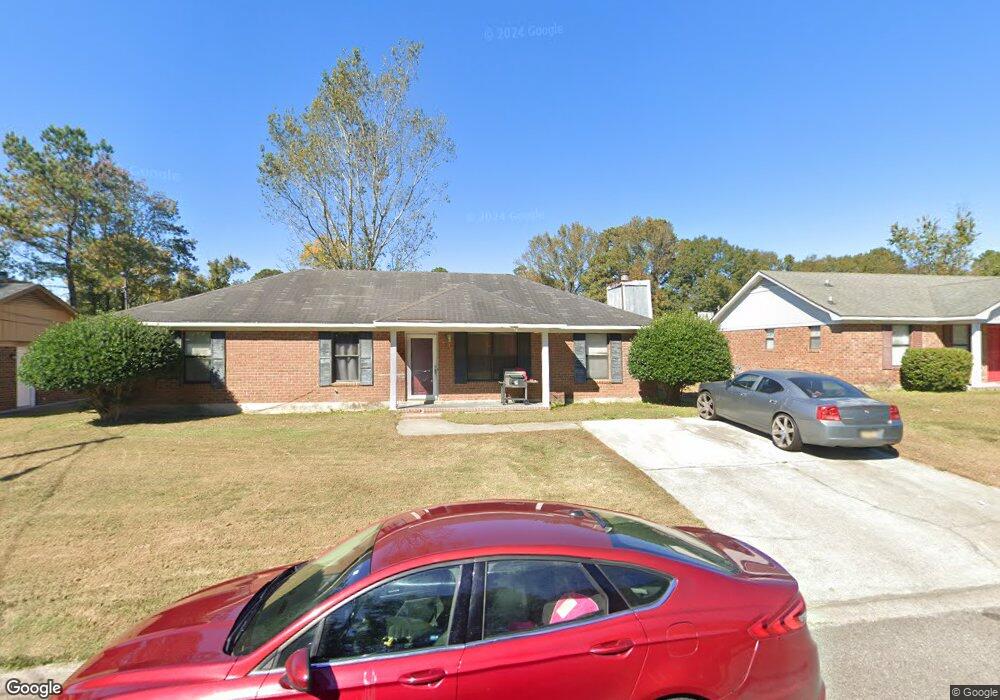
3527 Spring Glen Ln Augusta, GA 30906
Meadowbrook NeighborhoodEstimated Value: $172,000 - $216,000
3
Beds
2
Baths
1,500
Sq Ft
$131/Sq Ft
Est. Value
About This Home
This home is located at 3527 Spring Glen Ln, Augusta, GA 30906 and is currently estimated at $196,328, approximately $130 per square foot. 3527 Spring Glen Ln is a home located in Richmond County with nearby schools including Meadowbrook Elementary School, Glenn Hills Middle School, and Johnson Magnet.
Ownership History
Date
Name
Owned For
Owner Type
Purchase Details
Closed on
Jul 8, 2013
Sold by
Wilkins Kara
Bought by
Wilkins Valerie
Current Estimated Value
Home Financials for this Owner
Home Financials are based on the most recent Mortgage that was taken out on this home.
Original Mortgage
$63,600
Outstanding Balance
$46,077
Interest Rate
3.91%
Mortgage Type
New Conventional
Estimated Equity
$150,251
Purchase Details
Closed on
Feb 27, 2006
Sold by
Wilkins Samuel
Bought by
Wilkins Valerie R
Purchase Details
Closed on
Sep 17, 1993
Sold by
Veterans Affairs Se
Bought by
Wilkins Valerie R
Purchase Details
Closed on
Nov 3, 1992
Sold by
Fleet Real Estate F
Bought by
Veterans Affairs Se
Purchase Details
Closed on
Mar 23, 1990
Sold by
Nordahl Homes Inc
Bought by
Ortiz James
Create a Home Valuation Report for This Property
The Home Valuation Report is an in-depth analysis detailing your home's value as well as a comparison with similar homes in the area
Home Values in the Area
Average Home Value in this Area
Purchase History
| Date | Buyer | Sale Price | Title Company |
|---|---|---|---|
| Wilkins Valerie | -- | -- | |
| Wilkins Valerie R | -- | None Available | |
| Wilkins Valerie R | -- | -- | |
| Veterans Affairs Se | $54,000 | -- | |
| Ortiz James | $59,900 | -- |
Source: Public Records
Mortgage History
| Date | Status | Borrower | Loan Amount |
|---|---|---|---|
| Open | Wilkins Valerie | $63,600 |
Source: Public Records
Tax History Compared to Growth
Tax History
| Year | Tax Paid | Tax Assessment Tax Assessment Total Assessment is a certain percentage of the fair market value that is determined by local assessors to be the total taxable value of land and additions on the property. | Land | Improvement |
|---|---|---|---|---|
| 2025 | $2,131 | $61,824 | $6,800 | $55,024 |
| 2024 | $2,131 | $59,044 | $6,800 | $52,244 |
| 2023 | $1,983 | $56,332 | $6,800 | $49,532 |
| 2022 | $1,379 | $35,106 | $6,800 | $28,306 |
| 2021 | $1,468 | $34,880 | $6,800 | $28,080 |
| 2020 | $1,447 | $34,880 | $6,800 | $28,080 |
| 2019 | $1,524 | $34,880 | $6,800 | $28,080 |
| 2018 | $1,534 | $34,880 | $6,800 | $28,080 |
| 2017 | $1,471 | $34,880 | $6,800 | $28,080 |
| 2016 | $1,472 | $34,880 | $6,800 | $28,080 |
| 2015 | $1,482 | $34,880 | $6,800 | $28,080 |
| 2014 | $1,452 | $33,920 | $6,800 | $27,120 |
Source: Public Records
Map
Nearby Homes
- 2942 Dahlia Dr
- 3531 Spring Glen Ln
- 3621 Columbine Dr
- 3614 Rolling Meadows Dr
- 2902 Postell Ct
- 3632 Alene Cir
- 3007 Meadowbrook Dr
- 3013 Alene Ct
- 3602 Kinglet Ct
- 3439 Gebhardt Ct
- 2816 Leawood Ct
- 3042 Johnny Ct
- 3004 Georgia Rd
- 2911 Inwood Place
- 2538 Kensington Dr W
- 2527 Blackstone St
- 3421 Mcalpine Dr
- 3529 Evangeline Dr
- 2912 Butler Manor Dr
- 3407 Charing Cross Ct
- 3525 Spring Glen Ln
- 3529 Spring Glen Ln
- 2927 Dahlia Dr
- 2931 Dahlia Dr
- 3523 Spring Glen Ln
- 3534 Spring Glen Ln
- 3536 Spring Glen Ln
- 2925 Dahlia Dr
- 3532 Spring Glen Ln
- 3538 Spring Glen Ln
- 2933 Dahlia Dr
- 3521 Spring Glen Ln
- 2923 Dahlia Dr
- 3530 Spring Glen Ln
- 3533 Spring Glen Ln
- 3540 Spring Glen Ln
- 2940 Dahlia Dr
- 2938 Dahlia Dr
- 3629 Rolling Meadows Dr
- 2935 Dahlia Dr