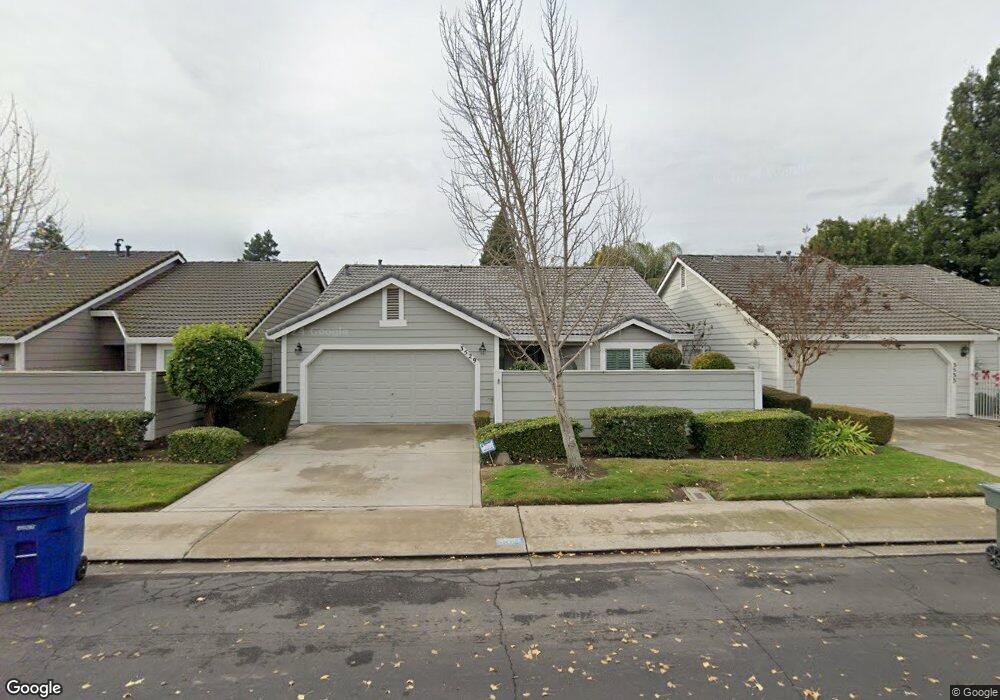
3529 Thomas More Way Modesto, CA 95356
Estimated Value: $419,209 - $478,000
3
Beds
2
Baths
1,373
Sq Ft
$328/Sq Ft
Est. Value
About This Home
This home is located at 3529 Thomas More Way, Modesto, CA 95356 and is currently estimated at $450,802, approximately $328 per square foot. 3529 Thomas More Way is a home located in Stanislaus County with nearby schools including Mary Lou Dieterich Elementary School, Prescott Junior High School, and Joseph A. Gregori High School.
Ownership History
Date
Name
Owned For
Owner Type
Purchase Details
Closed on
Jul 30, 2008
Sold by
Liu Qing
Bought by
Liu Qing and Liu Genfa
Current Estimated Value
Purchase Details
Closed on
May 29, 2008
Sold by
Soares John Larry and Soares Margaret H
Bought by
Liu Qing
Purchase Details
Closed on
May 27, 2008
Sold by
Wang Ying
Bought by
Liu Qing
Purchase Details
Closed on
Oct 4, 2004
Sold by
Mortenson Lola L and The Lola L Mortenson Living Tr
Bought by
Soares John Larry and Soares Margaret H
Home Financials for this Owner
Home Financials are based on the most recent Mortgage that was taken out on this home.
Original Mortgage
$222,800
Interest Rate
4.5%
Mortgage Type
Purchase Money Mortgage
Purchase Details
Closed on
Jan 21, 2003
Sold by
Mortenson Lola L
Bought by
Mortenson Lola L and The Lola L Mortenson Living Tr
Create a Home Valuation Report for This Property
The Home Valuation Report is an in-depth analysis detailing your home's value as well as a comparison with similar homes in the area
Home Values in the Area
Average Home Value in this Area
Purchase History
| Date | Buyer | Sale Price | Title Company |
|---|---|---|---|
| Liu Qing | -- | None Available | |
| Liu Qing | $265,000 | Chicago Title Company | |
| Liu Qing | -- | Chicago Title Company | |
| Soares John Larry | $278,500 | Alliance Title Company | |
| Mortenson Lola L | -- | -- |
Source: Public Records
Mortgage History
| Date | Status | Borrower | Loan Amount |
|---|---|---|---|
| Previous Owner | Soares John Larry | $222,800 |
Source: Public Records
Tax History Compared to Growth
Tax History
| Year | Tax Paid | Tax Assessment Tax Assessment Total Assessment is a certain percentage of the fair market value that is determined by local assessors to be the total taxable value of land and additions on the property. | Land | Improvement |
|---|---|---|---|---|
| 2025 | $3,932 | $348,066 | $105,073 | $242,993 |
| 2024 | $3,791 | $341,242 | $103,013 | $238,229 |
| 2023 | $3,721 | $334,552 | $100,994 | $233,558 |
| 2022 | $3,618 | $327,993 | $99,014 | $228,979 |
| 2021 | $3,418 | $321,563 | $97,073 | $224,490 |
| 2020 | $3,372 | $318,267 | $96,078 | $222,189 |
| 2019 | $3,330 | $312,028 | $94,195 | $217,833 |
| 2018 | $3,289 | $305,911 | $92,349 | $213,562 |
| 2017 | $2,888 | $270,500 | $135,000 | $135,500 |
| 2016 | $2,721 | $257,000 | $80,000 | $177,000 |
| 2015 | $2,373 | $223,500 | $41,500 | $182,000 |
| 2014 | $2,300 | $215,000 | $40,000 | $175,000 |
Source: Public Records
Map
Nearby Homes
- 2400 Dutchollow Ct
- 2344 St Lawrence Ln
- 2405 Veneman Ave
- 3713 Goyen Ct
- 2256 Camborne Dr
- 2244 Southport Ln
- 2308 van Der Goes Way
- 2500 van Hoeks Cir
- 2200 Arnhem Place
- 2604 Veneman Ave
- 2600 Konynenburg Ln
- 2153 Cheyenne Way
- 2601 Flanders Cir
- 3621 Viader Dr
- 2224 Northridge Dr
- 3124 Maplenut Ave
- 2124 Key West Ln
- 3040 Maplenut Ave
- 2305 Edmunds Ave
- 4008 Cortona Dr
- 3525 Thomas More Way
- 3533 Thomas More Way
- 3521 Thomas More Way
- 3537 Thomas More Way
- 2401 van Valin Place
- 2400 Van Pelt Place
- 3528 Thomas More Way
- 3541 Thomas More Way
- 3532 Thomas More Way
- 3520 Thomas More Way
- 2405 van Valin Place
- 3517 Thomas More Way
- 2404 Van Pelt Place
- 3536 Thomas More Way
- 2400 van Valin Place
- 3545 Thomas More Way
- 2341 St Lawrence Ln
- 3540 Thomas More Way
- 2336 Bromwich Ct
- 2352 St Lawrence Ln