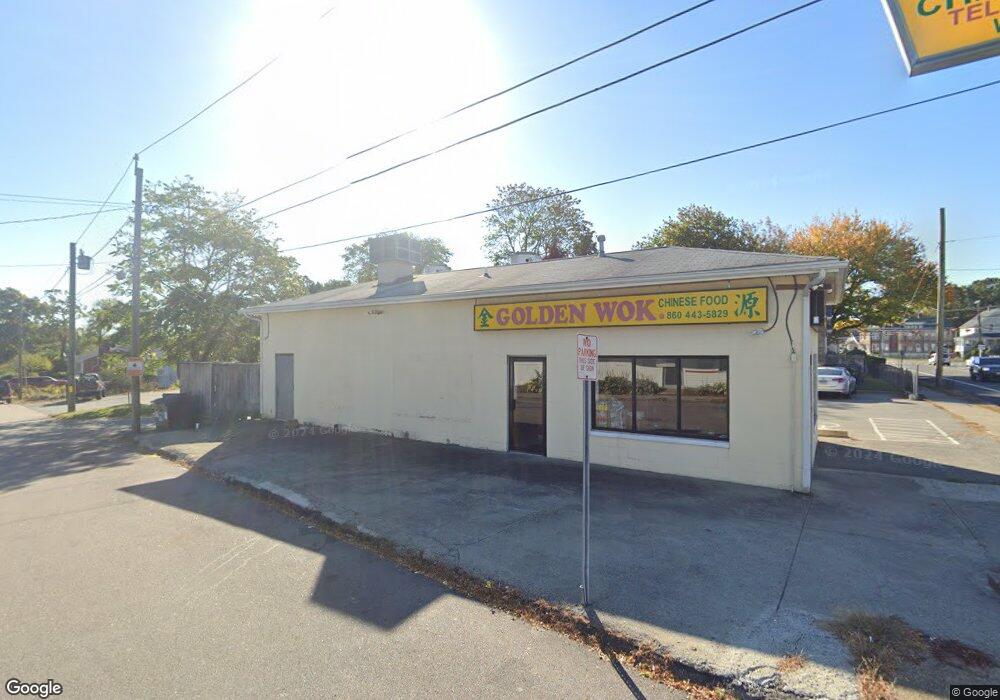
353 Colman St New London, CT 06320
Jefferson NeighborhoodEstimated Value: $727,504
--
Bed
--
Bath
--
Sq Ft
0.29
Acres
About This Home
This home is located at 353 Colman St, New London, CT 06320 and is currently estimated at $727,504. 353 Colman St is a home located in New London County with nearby schools including Harbor Elementary School, Bennie Dover Jackson Middle School, and New London High School.
Ownership History
Date
Name
Owned For
Owner Type
Purchase Details
Closed on
Oct 31, 2011
Sold by
Malerba Ralph and Malerba Marianne
Bought by
Zhang Jun Zhui
Current Estimated Value
Home Financials for this Owner
Home Financials are based on the most recent Mortgage that was taken out on this home.
Original Mortgage
$100,000
Outstanding Balance
$68,486
Interest Rate
4.11%
Mortgage Type
Commercial
Estimated Equity
$659,018
Purchase Details
Closed on
Oct 16, 2009
Sold by
Mercado Jose and Cales Lourdes
Bought by
Malera Marianne and Malera Ralph
Create a Home Valuation Report for This Property
The Home Valuation Report is an in-depth analysis detailing your home's value as well as a comparison with similar homes in the area
Home Values in the Area
Average Home Value in this Area
Purchase History
| Date | Buyer | Sale Price | Title Company |
|---|---|---|---|
| Zhang Jun Zhui | $360,000 | -- | |
| Zhang Jun Zhui | $360,000 | -- | |
| Malera Marianne | $320,000 | -- | |
| Malera Marianne | $320,000 | -- |
Source: Public Records
Mortgage History
| Date | Status | Borrower | Loan Amount |
|---|---|---|---|
| Open | Malera Marianne | $100,000 | |
| Closed | Malera Marianne | $100,000 |
Source: Public Records
Tax History Compared to Growth
Tax History
| Year | Tax Paid | Tax Assessment Tax Assessment Total Assessment is a certain percentage of the fair market value that is determined by local assessors to be the total taxable value of land and additions on the property. | Land | Improvement |
|---|---|---|---|---|
| 2025 | $9,104 | $334,700 | $140,000 | $194,700 |
| 2024 | $9,204 | $334,700 | $140,000 | $194,700 |
| 2023 | $9,809 | $263,410 | $123,200 | $140,210 |
| 2022 | $9,828 | $263,410 | $123,200 | $140,210 |
| 2021 | $9,996 | $263,410 | $123,200 | $140,210 |
| 2020 | $10,060 | $263,410 | $123,200 | $140,210 |
| 2019 | $10,510 | $263,410 | $123,200 | $140,210 |
| 2018 | $9,112 | $208,320 | $74,690 | $133,630 |
| 2017 | $9,220 | $208,320 | $74,690 | $133,630 |
| 2016 | $8,429 | $208,320 | $74,690 | $133,630 |
| 2015 | $8,227 | $208,320 | $74,690 | $133,630 |
| 2014 | $7,139 | $208,320 | $74,690 | $133,630 |
Source: Public Records
Map
Nearby Homes
- 226 Colman St
- 18 W Pleasant St
- 385 Broad St
- 139 Vauxhall St
- 68 Raymond St
- 59 Connecticut Ave
- 55 Connecticut Ave
- 77 Colman St
- 23 Whittlesey St
- 140 Norwood Ave
- 38 Mountain Ave
- 171 Norwood Ave
- 26 Jefferson Ave
- 49 Belden St
- 835 Bank St
- 5 Windy Ridge Place Unit 5
- 30 Margaret St
- 19 Hawthorne Dr Unit 104
- 2 Faye St
- 47 Phillips St