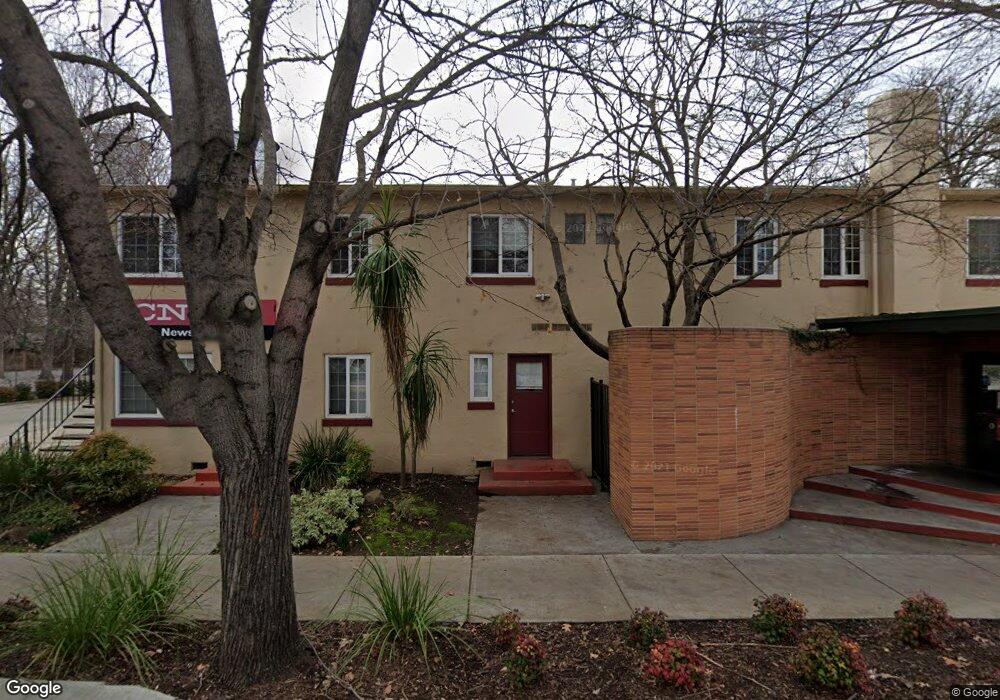
353 E 2nd St Unit 130 Chico, CA 95928
Downtown Chico NeighborhoodEstimated Value: $849,603
Studio
--
Bath
--
Sq Ft
8,276
Sq Ft Lot
About This Home
This home is located at 353 E 2nd St Unit 130, Chico, CA 95928 and is currently estimated at $849,603. 353 E 2nd St Unit 130 is a home located in Butte County with nearby schools including Parkview Elementary School, Chico Junior High School, and Chico High School.
Ownership History
Date
Name
Owned For
Owner Type
Purchase Details
Closed on
Aug 25, 2021
Sold by
Chico Community Publishing Inc
Bought by
Prosperity Investment Offices Llc
Current Estimated Value
Purchase Details
Closed on
Feb 3, 2006
Sold by
Chico Community Publishing Inc
Bought by
Chico Community Publishing Inc
Home Financials for this Owner
Home Financials are based on the most recent Mortgage that was taken out on this home.
Original Mortgage
$487,500
Interest Rate
6.16%
Mortgage Type
Commercial
Create a Home Valuation Report for This Property
The Home Valuation Report is an in-depth analysis detailing your home's value as well as a comparison with similar homes in the area
Home Values in the Area
Average Home Value in this Area
Purchase History
| Date | Buyer | Sale Price | Title Company |
|---|---|---|---|
| Prosperity Investment Offices Llc | $855,000 | Mid Valley Title & Escrow Co | |
| Chico Community Publishing Inc | -- | Bidwell Title & Escrow Co |
Source: Public Records
Mortgage History
| Date | Status | Borrower | Loan Amount |
|---|---|---|---|
| Previous Owner | Chico Community Publishing Inc | $487,500 |
Source: Public Records
Tax History
| Year | Tax Paid | Tax Assessment Tax Assessment Total Assessment is a certain percentage of the fair market value that is determined by local assessors to be the total taxable value of land and additions on the property. | Land | Improvement |
|---|---|---|---|---|
| 2025 | $11,136 | $978,732 | $238,771 | $739,961 |
| 2024 | $11,136 | $889,542 | $234,090 | $655,452 |
| 2023 | $11,019 | $872,100 | $229,500 | $642,600 |
| 2022 | $10,804 | $855,000 | $225,000 | $630,000 |
| 2021 | $8,373 | $642,926 | $154,321 | $488,605 |
| 2020 | $8,311 | $635,697 | $152,739 | $482,958 |
| 2019 | $8,203 | $625,195 | $149,745 | $475,450 |
| 2018 | $8,225 | $629,280 | $146,809 | $482,471 |
| 2017 | $8,099 | $618,468 | $143,931 | $474,537 |
| 2016 | $6,385 | $606,754 | $141,109 | $465,645 |
| 2015 | $6,412 | $600,172 | $138,990 | $461,182 |
| 2014 | $6,299 | $592,381 | $136,268 | $456,113 |
Source: Public Records
Map
Nearby Homes
- 686 E 7th St
- 555 Vallombrosa Ave Unit 14
- 555 Vallombrosa Ave Unit 25
- 0 California 32
- 271 E 8th St
- 667 E 8th St
- 541 W 5th St
- 827 Arbutus Ave
- 363 E 1st Ave
- 1050 Esplanade
- 256 E 1st Ave
- 1001 Salem St
- 168 E 1st Ave
- 1029 Salem St
- 557 E 1st Ave
- 1224 Locust St
- 0 W 7th St
- 1202 Palm Ave
- 225 W 12th St
- 1022 Linden St
Your Personal Tour Guide
Ask me questions while you tour the home.