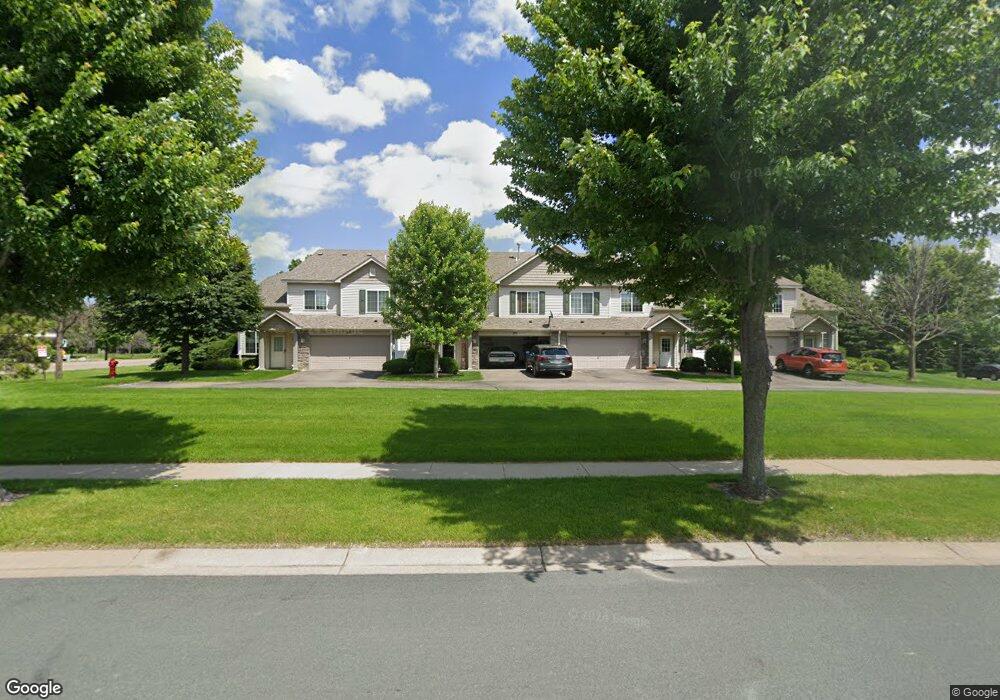
353 Ojibway Path Circle Pines, MN 55014
Estimated Value: $239,000 - $263,000
2
Beds
2
Baths
1,440
Sq Ft
$176/Sq Ft
Est. Value
About This Home
This home is located at 353 Ojibway Path, Circle Pines, MN 55014 and is currently estimated at $253,145, approximately $175 per square foot. 353 Ojibway Path is a home located in Anoka County with nearby schools including Rice Lake Elementary School, Centennial Middle School, and Centennial High School.
Ownership History
Date
Name
Owned For
Owner Type
Purchase Details
Closed on
Jun 29, 2020
Sold by
Evans David J and Evans Ashley M
Bought by
Freppert James E and Gowan Elizabeth
Current Estimated Value
Home Financials for this Owner
Home Financials are based on the most recent Mortgage that was taken out on this home.
Original Mortgage
$195,940
Outstanding Balance
$172,189
Interest Rate
3.1%
Mortgage Type
New Conventional
Estimated Equity
$80,956
Purchase Details
Closed on
Jul 28, 2015
Sold by
Bohn Kathryn Lynn
Bought by
Evans David J and Waite Ashley M
Home Financials for this Owner
Home Financials are based on the most recent Mortgage that was taken out on this home.
Original Mortgage
$6,000
Interest Rate
4.08%
Mortgage Type
Unknown
Purchase Details
Closed on
May 11, 2009
Sold by
Bank Of Ny Mellon
Bought by
Bohn Kathryn Lynn
Home Financials for this Owner
Home Financials are based on the most recent Mortgage that was taken out on this home.
Original Mortgage
$123,405
Interest Rate
4.85%
Mortgage Type
New Conventional
Create a Home Valuation Report for This Property
The Home Valuation Report is an in-depth analysis detailing your home's value as well as a comparison with similar homes in the area
Home Values in the Area
Average Home Value in this Area
Purchase History
| Date | Buyer | Sale Price | Title Company |
|---|---|---|---|
| Freppert James E | $202,000 | Titlesmart Inc | |
| Evans David J | $145,651 | Titlesmart Inc | |
| Bohn Kathryn Lynn | $129,900 | -- |
Source: Public Records
Mortgage History
| Date | Status | Borrower | Loan Amount |
|---|---|---|---|
| Open | Freppert James E | $195,940 | |
| Previous Owner | Evans David J | $6,000 | |
| Previous Owner | Evans David J | $143,011 | |
| Previous Owner | Bohn Kathryn Lynn | $123,405 |
Source: Public Records
Tax History
| Year | Tax Paid | Tax Assessment Tax Assessment Total Assessment is a certain percentage of the fair market value that is determined by local assessors to be the total taxable value of land and additions on the property. | Land | Improvement |
|---|---|---|---|---|
| 2025 | $3,043 | $236,700 | $57,300 | $179,400 |
| 2024 | $3,043 | $233,800 | $53,500 | $180,300 |
| 2023 | $3,019 | $230,300 | $47,200 | $183,100 |
| 2022 | $2,430 | $231,500 | $42,900 | $188,600 |
| 2021 | $2,277 | $202,300 | $27,700 | $174,600 |
| 2020 | $2,194 | $186,700 | $24,200 | $162,500 |
| 2019 | $2,052 | $175,000 | $23,000 | $152,000 |
| 2018 | $1,663 | $157,600 | $0 | $0 |
| 2017 | $1,569 | $143,900 | $0 | $0 |
| 2016 | $1,652 | $133,000 | $0 | $0 |
| 2015 | $1,545 | $133,000 | $20,400 | $112,600 |
| 2014 | -- | $114,000 | $17,800 | $96,200 |
Source: Public Records
Map
Nearby Homes
- 6422 Lakota Trail
- 6415 Lakota Trail
- 6473 Totem Trail
- 476 Hawthorn Rd
- 365 Sioux Lookout
- 553 Hawthorn Rd
- 8088 Haywood Dr
- 336 Ravens Ct
- 6153 Hodgson Rd
- 6326 White Owl Dr
- 749 Fox Rd
- 215 Keith Rd
- 6065 Ware Rd
- 115 Woodridge Ln
- 110 South Dr
- 104 South Dr Unit B
- 8 Pointcross Dr
- 102 Woodridge Ln
- 849 Fox Cove
- 6824 W Shadow Lake Dr
- 351 Ojibway Path
- 361 Ojibway Path
- 363 Ojibway Path
- 359 Ojibway Path
- 349 Ojibway Path
- 357 Ojibway Path
- 355 Ojibway Path
- 369 Ojibway Path
- 371 Ojibway Path
- 365 Ojibway Path
- 375 Ojibway Path
- 379 Ojibway Path
- 377 Ojibway Path
- 373 Ojibway Path
- 385 Ojibway Path
- 387 Ojibway Path
- 381 Ojibway Path
- 383 Ojibway Path
- 395 Ojibway Path
- 6481 Ojibway Path
Your Personal Tour Guide
Ask me questions while you tour the home.