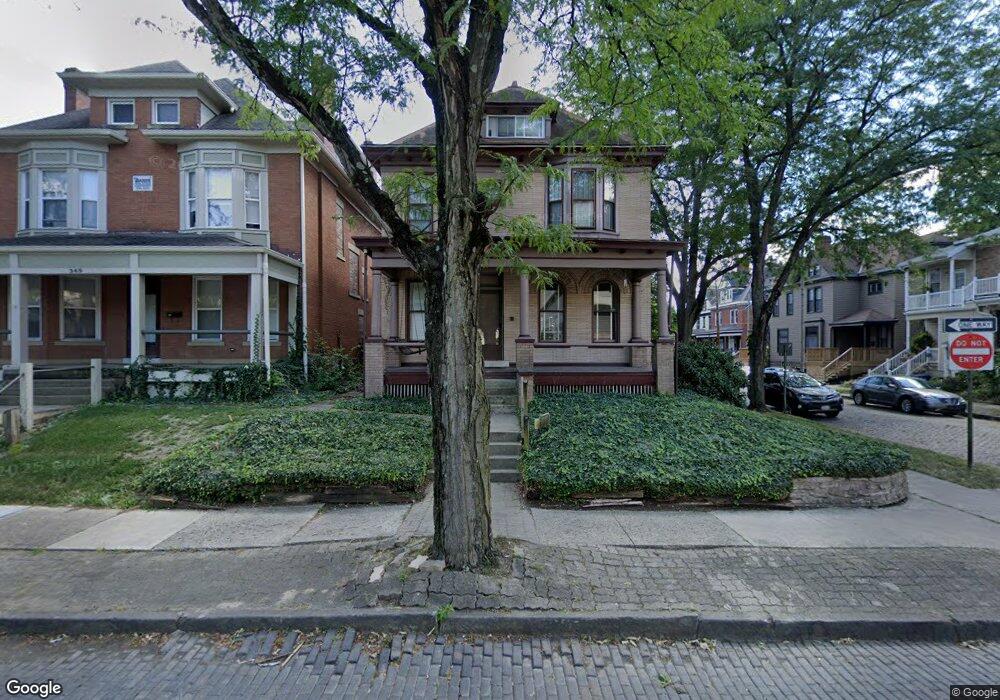
353 W 8th Ave Columbus, OH 43201
Dennison Place NeighborhoodEstimated Value: $410,000 - $570,000
6
Beds
2
Baths
--
Sq Ft
2,701
Sq Ft Lot
About This Home
This home is located at 353 W 8th Ave, Columbus, OH 43201 and is currently estimated at $494,029. 353 W 8th Ave is a home located in Franklin County with nearby schools including Hubbard Elementary School, Dominion Middle School, and Whetstone High School.
Ownership History
Date
Name
Owned For
Owner Type
Purchase Details
Closed on
May 15, 2020
Sold by
353 West Eighth Llc
Bought by
353 W 8Th Ave Llc
Current Estimated Value
Purchase Details
Closed on
Apr 22, 2010
Sold by
Handler Stephen M and Handler Carol S
Bought by
353 West Eighth Llc
Purchase Details
Closed on
Mar 16, 2004
Sold by
Alcott William M and Alcott Pouneh
Bought by
Handler Stephen M
Home Financials for this Owner
Home Financials are based on the most recent Mortgage that was taken out on this home.
Original Mortgage
$128,000
Interest Rate
5.65%
Mortgage Type
Purchase Money Mortgage
Purchase Details
Closed on
May 3, 1979
Bought by
Alcott William M
Create a Home Valuation Report for This Property
The Home Valuation Report is an in-depth analysis detailing your home's value as well as a comparison with similar homes in the area
Home Values in the Area
Average Home Value in this Area
Purchase History
| Date | Buyer | Sale Price | Title Company |
|---|---|---|---|
| 353 W 8Th Ave Llc | -- | Clean Title Agency Inc | |
| 353 West Eighth Llc | -- | Attorney | |
| Handler Stephen M | $160,000 | Chicago Title | |
| Alcott William M | $31,900 | -- |
Source: Public Records
Mortgage History
| Date | Status | Borrower | Loan Amount |
|---|---|---|---|
| Previous Owner | Handler Stephen M | $128,000 |
Source: Public Records
Tax History Compared to Growth
Tax History
| Year | Tax Paid | Tax Assessment Tax Assessment Total Assessment is a certain percentage of the fair market value that is determined by local assessors to be the total taxable value of land and additions on the property. | Land | Improvement |
|---|---|---|---|---|
| 2024 | $5,149 | $112,360 | $23,700 | $88,660 |
| 2023 | $5,085 | $112,360 | $23,700 | $88,660 |
| 2022 | $4,706 | $88,550 | $13,090 | $75,460 |
| 2021 | $4,714 | $88,550 | $13,090 | $75,460 |
| 2020 | $4,721 | $88,550 | $13,090 | $75,460 |
| 2019 | $4,789 | $77,010 | $11,380 | $65,630 |
| 2018 | $4,393 | $77,010 | $11,380 | $65,630 |
| 2017 | $4,594 | $77,010 | $11,380 | $65,630 |
| 2016 | $4,400 | $64,760 | $11,380 | $53,380 |
| 2015 | $4,006 | $64,760 | $11,380 | $53,380 |
| 2014 | $4,015 | $64,760 | $11,380 | $53,380 |
| 2013 | $1,980 | $64,750 | $11,375 | $53,375 |
Source: Public Records
Map
Nearby Homes
- 343 King Ave Unit 345
- 396 W 7th Ave
- 398 W 5th Ave
- 1438-1440 Hunter Ave
- 1245 Pennsylvania Ave
- 154-156 W 6th Ave
- 93 King Ave Unit 95
- 512 Riverfront Ln
- 516 Riverfront Ln
- 506 Riverfront Ln
- 502 Riverfront Ln
- 477 W 4th Ave
- 1298 Hunter Ave
- 42 King Ave
- 1173 Perry St Unit 20P
- 63 Smith Place
- 6 1/2 Clark Place
- 537 W 3rd Ave Unit 537
- 49 Euclid Ave
- 1276 N High St Unit 206
- 349 W 8th Ave
- 1500 Michigan Ave Unit 502
- 345 W 8th Ave
- 367 W 8th Ave
- 1507 Michigan Ave
- 1501 Michigan Ave Unit 507
- 1501 Michigan Ave
- 1496 Michigan Ave
- 1494 Michigan Ave Unit .5
- 1494 Michigan Ave
- 375 W 8th Ave
- 1492 Michigan Ave
- 1495 Michigan Ave Unit 497
- 1490 Michigan Ave
- 329 W 8th Ave
- 1488 Michigan Ave
- 379 W 8th Ave
- 325 W 8th Ave
- 1480 Michigan Ave Unit G
- 1480 Michigan Ave Unit EF