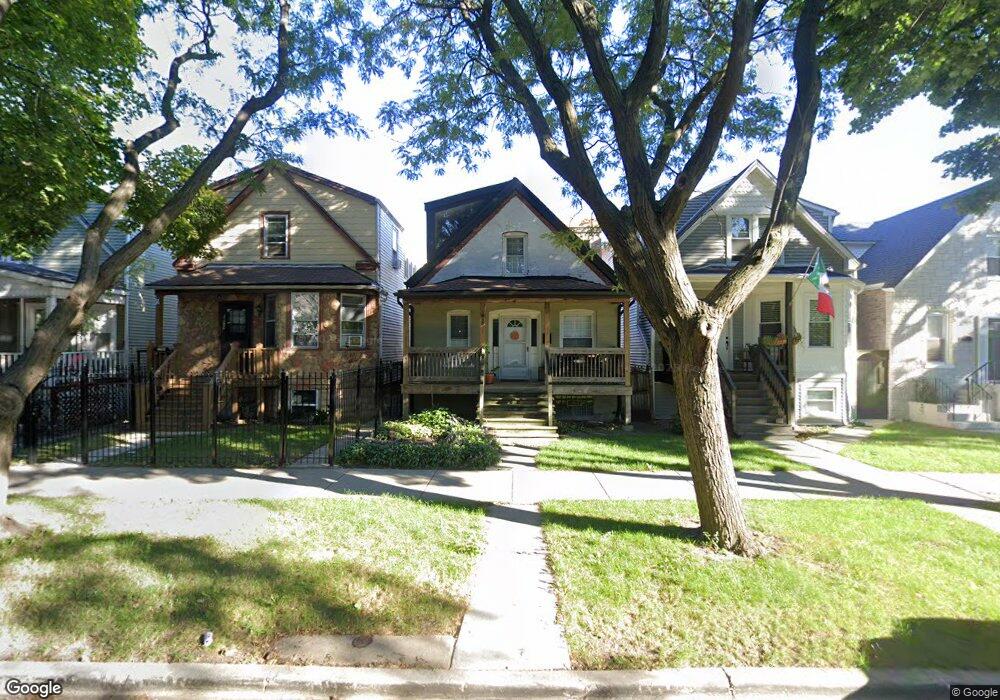
3530 W Melrose St Chicago, IL 60618
Avondale NeighborhoodEstimated Value: $430,000 - $562,000
3
Beds
2
Baths
1,251
Sq Ft
$393/Sq Ft
Est. Value
About This Home
This home is located at 3530 W Melrose St, Chicago, IL 60618 and is currently estimated at $491,378, approximately $392 per square foot. 3530 W Melrose St is a home located in Cook County with nearby schools including Reilly Elementary School, Schurz High School, and Aspira Business & Finance High School.
Ownership History
Date
Name
Owned For
Owner Type
Purchase Details
Closed on
Jan 18, 2013
Sold by
Ignatova Victoria
Bought by
Hristov Anguel and Ignatova Victoria
Current Estimated Value
Home Financials for this Owner
Home Financials are based on the most recent Mortgage that was taken out on this home.
Original Mortgage
$170,000
Outstanding Balance
$121,046
Interest Rate
4.12%
Mortgage Type
New Conventional
Estimated Equity
$370,332
Purchase Details
Closed on
Jan 13, 2010
Sold by
Morequity Inc
Bought by
Hristov Anguel
Purchase Details
Closed on
Apr 21, 2009
Sold by
Wentz Jack C
Bought by
Morequity Inc
Purchase Details
Closed on
Jun 7, 2002
Sold by
Kinsler Anthony E and Kinsler Carmen R
Bought by
Wentz Jack C and Wentz Patricia A
Home Financials for this Owner
Home Financials are based on the most recent Mortgage that was taken out on this home.
Original Mortgage
$190,000
Interest Rate
6.7%
Create a Home Valuation Report for This Property
The Home Valuation Report is an in-depth analysis detailing your home's value as well as a comparison with similar homes in the area
Home Values in the Area
Average Home Value in this Area
Purchase History
| Date | Buyer | Sale Price | Title Company |
|---|---|---|---|
| Hristov Anguel | -- | None Available | |
| Hristov Anguel | $75,500 | Forum Title Insurance Co | |
| Morequity Inc | -- | Attorneys Title Guaranty Fun | |
| Wentz Jack C | $200,000 | -- |
Source: Public Records
Mortgage History
| Date | Status | Borrower | Loan Amount |
|---|---|---|---|
| Open | Hristov Anguel | $170,000 | |
| Previous Owner | Wentz Jack C | $190,000 |
Source: Public Records
Tax History
| Year | Tax Paid | Tax Assessment Tax Assessment Total Assessment is a certain percentage of the fair market value that is determined by local assessors to be the total taxable value of land and additions on the property. | Land | Improvement |
|---|---|---|---|---|
| 2025 | $7,340 | $40,001 | $13,703 | $26,298 |
| 2024 | $7,340 | $40,001 | $13,703 | $26,298 |
| 2023 | $7,584 | $37,959 | $11,025 | $26,934 |
| 2022 | $7,584 | $40,148 | $11,025 | $29,123 |
| 2021 | $7,432 | $40,148 | $11,025 | $29,123 |
| 2020 | $4,995 | $25,431 | $5,040 | $20,391 |
| 2019 | $6,012 | $33,226 | $5,040 | $28,186 |
| 2018 | $5,888 | $33,226 | $5,040 | $28,186 |
| 2017 | $5,141 | $27,244 | $4,410 | $22,834 |
| 2016 | $4,959 | $27,244 | $4,410 | $22,834 |
| 2015 | $4,514 | $27,244 | $4,410 | $22,834 |
| 2014 | $2,729 | $17,267 | $3,780 | $13,487 |
| 2013 | $2,664 | $17,267 | $3,780 | $13,487 |
Source: Public Records
Map
Nearby Homes
- 3222 N Drake Ave
- 3261 N Central Park Ave
- 3510 W Melrose St
- 3435 W Belmont Ave Unit 1S
- 3037 N Central Park Ave
- 3101 N Ridgeway Ave Unit 4D
- 3027 N Elbridge Ave
- 2955 N Gresham Ave
- 3120 N Spaulding Ave
- 3057 N Christiana Ave
- 3055 N Christiana Ave
- 3011 N Kimball Ave
- 3137 N Spaulding Ave
- 3317 N Avers Ave
- 3708 W Cornelia Ave Unit 1E
- 3752 W Cornelia Ave
- 3104 N Davlin Ct
- 3039 N Haussen Ct
- 3518 W Wolfram St Unit 2
- 3036 N Kedzie Ave
- 3528 W Melrose St
- 3532 W Melrose St
- 3524 W Melrose St
- 3534 W Melrose St
- 3522 W Melrose St
- 3538 W Melrose St
- 3538 W Melrose St
- 3520 W Melrose St
- 3518 W Melrose St
- 3525 W School St Unit 1
- 3525 W School St
- 3516 W Melrose St
- 3529 W Melrose St
- 1238 W Melrose St
- 3529 W School St
- 3512 W Melrose St
- 3533 W Melrose St
- 3533 W School St
- 3523 W Melrose St
- 3523 W Melrose St
Your Personal Tour Guide
Ask me questions while you tour the home.