Estimated Value: $640,000 - $733,000
3
Beds
3
Baths
1,761
Sq Ft
$382/Sq Ft
Est. Value
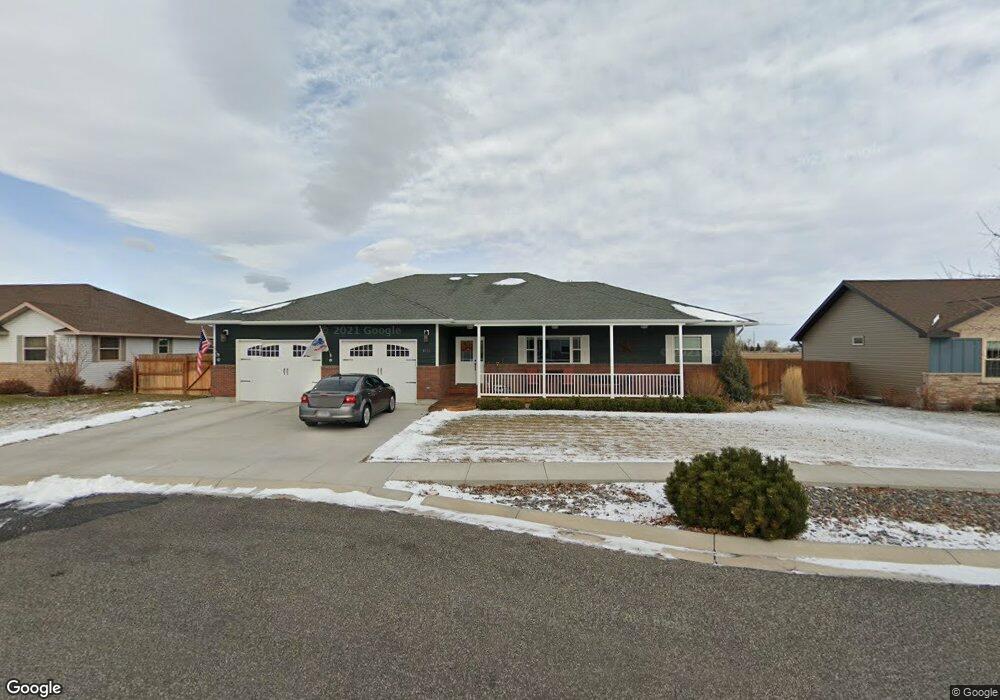
About This Home
This home is located at 3531 Maple Leaf Ave, Cody, WY 82414 and is currently estimated at $671,949, approximately $381 per square foot. 3531 Maple Leaf Ave is a home located in Park County with nearby schools including Cody Middle School, Cody High School, and Park Christian Schools.
Ownership History
Date
Name
Owned For
Owner Type
Purchase Details
Closed on
Feb 14, 2013
Sold by
Blaylock Jill M
Bought by
Blaylock Stephen T and Blaylock Jill M
Current Estimated Value
Home Financials for this Owner
Home Financials are based on the most recent Mortgage that was taken out on this home.
Original Mortgage
$130,500
Outstanding Balance
$58,875
Interest Rate
3.38%
Mortgage Type
Purchase Money Mortgage
Estimated Equity
$613,074
Purchase Details
Closed on
Oct 28, 2008
Sold by
Mcdonald Dan H and Mcdonald Nancy A
Bought by
Blaylock Stephen T and Blaylock Jill M
Home Financials for this Owner
Home Financials are based on the most recent Mortgage that was taken out on this home.
Original Mortgage
$295,684
Interest Rate
6%
Mortgage Type
Seller Take Back
Create a Home Valuation Report for This Property
The Home Valuation Report is an in-depth analysis detailing your home's value as well as a comparison with similar homes in the area
Home Values in the Area
Average Home Value in this Area
Purchase History
| Date | Buyer | Sale Price | Title Company |
|---|---|---|---|
| Blaylock Stephen T | -- | None Available | |
| Blaylock Stephen T | -- | None Available |
Source: Public Records
Mortgage History
| Date | Status | Borrower | Loan Amount |
|---|---|---|---|
| Open | Blaylock Stephen T | $130,500 | |
| Previous Owner | Blaylock Stephen T | $295,684 |
Source: Public Records
Tax History Compared to Growth
Tax History
| Year | Tax Paid | Tax Assessment Tax Assessment Total Assessment is a certain percentage of the fair market value that is determined by local assessors to be the total taxable value of land and additions on the property. | Land | Improvement |
|---|---|---|---|---|
| 2025 | $3,668 | $49,240 | $7,136 | $42,104 |
| 2024 | $4,507 | $63,495 | $9,515 | $53,980 |
| 2023 | $4,352 | $61,419 | $9,515 | $51,904 |
| 2022 | $3,698 | $52,230 | $7,655 | $44,575 |
| 2021 | $2,960 | $42,466 | $5,818 | $36,648 |
| 2020 | $2,810 | $40,467 | $5,818 | $34,649 |
| 2019 | $2,733 | $39,434 | $5,818 | $33,616 |
| 2018 | $2,502 | $36,365 | $5,818 | $30,547 |
| 2017 | $2,461 | $35,813 | $5,427 | $30,386 |
| 2016 | $2,443 | $35,578 | $5,403 | $30,175 |
| 2015 | $2,374 | $34,242 | $5,403 | $28,839 |
| 2014 | $2,179 | $33,867 | $5,403 | $28,464 |
Source: Public Records
Map
Nearby Homes
- 3640 Big Horn Ave
- 3131 Hardpan Ave
- 3119 Hardpan Ave
- TBD 33rd St Unit Lot 5
- 138 Pleasant View Dr
- 619 Go Around Loop
- 3120 E Ave
- TBD Highway 14a W
- 3005 Kent Ave
- 2919 Faith Ct
- 2950 Kent Ave
- 908 35th St
- 913 34th St
- 3414 Frisby Ave
- 2850 Kent Ave Unit E-31
- 2850 Kent Ave Unit E-14
- 0 Pintail St Unit 4 and 5 10019708
- 0 Pintail St Unit 6 thru 12 10019710
- 0 Pintail St Unit 1-2-3 10019709
- 228 C St
- 3531 Maple Leaf Ave Unit 4
- 3525 Maple Leaf Ave
- 3537 Maple Leaf Ave
- tbd Maple Leaf Ave
- 3519 Maple Leaf Ave
- 3532 Maple Leaf Ave
- 3538 Maple Leaf Ave
- 3526 Maple Leaf Ave
- 3602 Maple Leaf Ave
- 3520 Maple Leaf Ave
- 3607 Maple Leaf Ave
- 3608 Maple Leaf Ave
- 3514 Maple Leaf Ave
- 3514 Maple Leaf Ave Unit 24
- 3613 Maple Leaf Ave
- 3508 Maple Leaf Ave
- 228 Cooper Ln W
- 3507 Maple Leaf Ave
- 3619 Maple Leaf Ave
- 3502 Maple Leaf Ave