35317 Ramsgate Rd the Sea Ranch, CA 95497
The Sea Ranch NeighborhoodEstimated Value: $1,064,000 - $1,419,584
3
Beds
2
Baths
2,165
Sq Ft
$585/Sq Ft
Est. Value
About This Home
This home is located at 35317 Ramsgate Rd, the Sea Ranch, CA 95497 and is currently estimated at $1,266,146, approximately $584 per square foot. 35317 Ramsgate Rd is a home located in Sonoma County with nearby schools including Point Arena High School.
Ownership History
Date
Name
Owned For
Owner Type
Purchase Details
Closed on
Nov 30, 2012
Sold by
Hocking F Paul and Mcquinn Anna Maria
Bought by
Browne Niall and Moran Maria
Current Estimated Value
Home Financials for this Owner
Home Financials are based on the most recent Mortgage that was taken out on this home.
Original Mortgage
$500,000
Outstanding Balance
$346,255
Interest Rate
3.36%
Mortgage Type
Seller Take Back
Estimated Equity
$919,891
Purchase Details
Closed on
Jan 22, 2007
Sold by
Hocking F Paul and Mcquinn Anna Maria
Bought by
Hocking F Paul and Mcquinn Anna Maria
Purchase Details
Closed on
Oct 28, 2006
Sold by
Hocking F Paul and Mcquinn Anna Maria
Bought by
Hocking F Paul and Mcquinn Anna Maria
Purchase Details
Closed on
Oct 17, 1998
Sold by
Hocking F Paul and Mcquinn Anna Maria
Bought by
Hocking F Paul and Mcquinn Anna Maria
Purchase Details
Closed on
Sep 2, 1997
Sold by
Mcquinn Anna
Bought by
Hocking F Paul
Home Financials for this Owner
Home Financials are based on the most recent Mortgage that was taken out on this home.
Original Mortgage
$170,000
Interest Rate
7.34%
Create a Home Valuation Report for This Property
The Home Valuation Report is an in-depth analysis detailing your home's value as well as a comparison with similar homes in the area
Home Values in the Area
Average Home Value in this Area
Purchase History
| Date | Buyer | Sale Price | Title Company |
|---|---|---|---|
| Browne Niall | $500,000 | Fidelity National Title Co | |
| Hocking F Paul | -- | None Available | |
| Hocking F Paul | -- | None Available | |
| Hocking F Paul | -- | -- | |
| Hocking F Paul | -- | North Bay Title Co | |
| Mcquinn Anna | -- | North Bay Title Co | |
| Hooking F Paul | $374,000 | North Bay Title Co |
Source: Public Records
Mortgage History
| Date | Status | Borrower | Loan Amount |
|---|---|---|---|
| Open | Browne Niall | $500,000 | |
| Previous Owner | Hooking F Paul | $170,000 |
Source: Public Records
Tax History
| Year | Tax Paid | Tax Assessment Tax Assessment Total Assessment is a certain percentage of the fair market value that is determined by local assessors to be the total taxable value of land and additions on the property. | Land | Improvement |
|---|---|---|---|---|
| 2025 | $6,978 | $615,700 | $184,707 | $430,993 |
| 2024 | $6,978 | $603,629 | $181,086 | $422,543 |
| 2023 | $6,978 | $591,794 | $177,536 | $414,258 |
| 2022 | $6,585 | $580,191 | $174,055 | $406,136 |
| 2021 | $6,478 | $568,816 | $170,643 | $398,173 |
| 2020 | $6,501 | $562,985 | $168,894 | $394,091 |
| 2019 | $6,449 | $551,947 | $165,583 | $386,364 |
| 2018 | $6,140 | $541,126 | $162,337 | $378,789 |
| 2017 | $6,262 | $530,516 | $159,154 | $371,362 |
| 2016 | $6,162 | $520,115 | $156,034 | $364,081 |
| 2015 | -- | $512,304 | $153,691 | $358,613 |
| 2014 | -- | $502,270 | $150,681 | $351,589 |
Source: Public Records
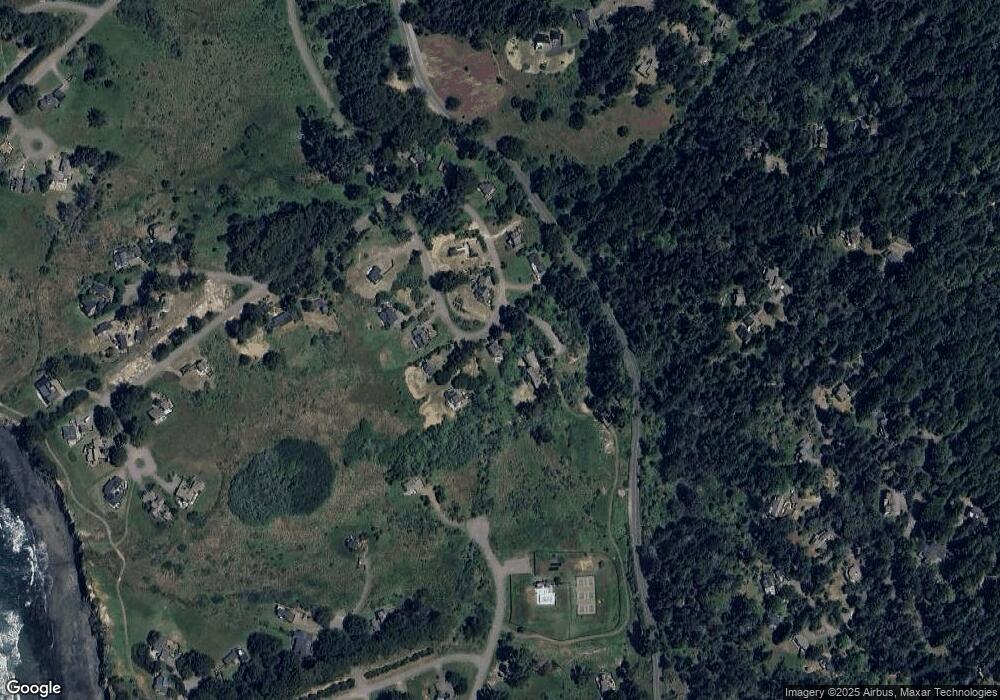
Map
Nearby Homes
- 135 Shepherds Close
- 116 Shepherds Close
- 316 Constellation Close
- 68 Black Point Close
- 35261 Windsong Ln
- 35205 Fly Cloud Rd
- 35411 Fly Cloud Rd
- 35402 Fly Cloud Rd
- 35412 Sea Gate Rd
- 35427 Sea Gate Rd
- 105 Hares Tail Close
- 64 Whalers Reach
- 33300 Sea Forest Dr
- 36029 Timber Ridge Rd
- 36221 Timber Ridge Rd
- 350 Conifer Close
- 375 Spur Close
- 253 Spur Close
- 1101 River Beach Rd
- 33755 Yardarm Dr
- 35309 Rams Gate Rd
- 35331 Ramsgate Rd
- 35321 Ramsgate Rd
- 35339 Ramsgate Rd
- 35345 Ramsgate Rd
- 35116 Ramsgate Rd
- 35326 Rams Gate
- 35330 Ramsgate Rd
- 35351 Ramsgate Rd
- 35357 Ramsgate Rd
- 35366 Moonraker Rd
- 35336 Ramsgate Rd
- 126 Horizon Reach
- 35344 Ramsgate Rd
- 122 Horizon Reach
- 35350 Ramsgate Rd
- 35300 Spyglass Ln
- 35303 Spyglass Ln
- 139 Cypress Close
- 139 Cypress Close Unkn
Your Personal Tour Guide
Ask me questions while you tour the home.