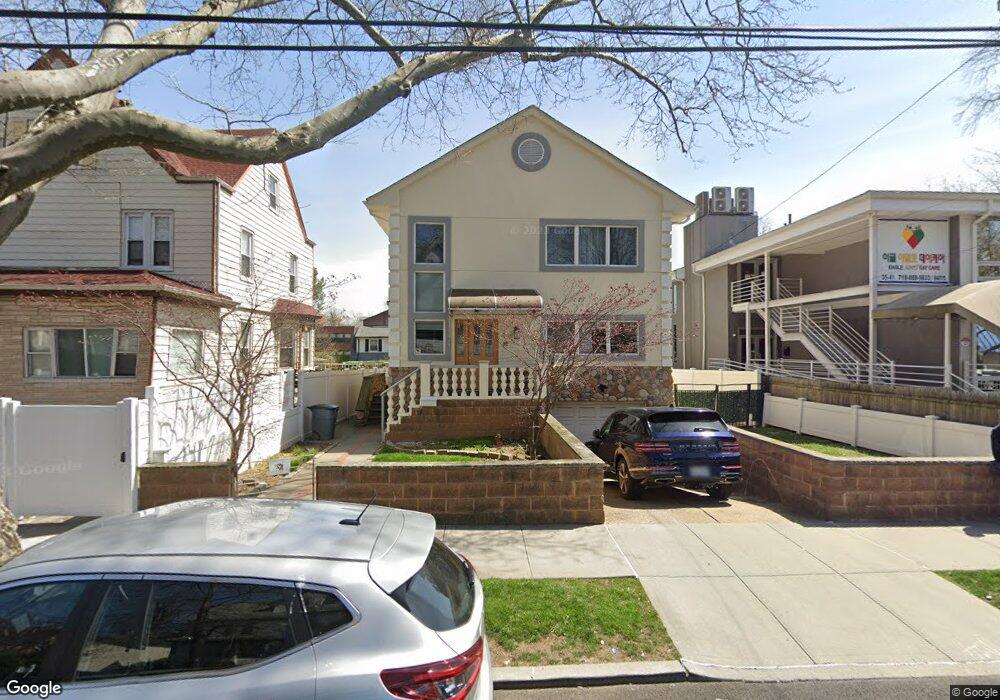
3535 156th St Flushing, NY 11354
Murray Hill-Broadway NeighborhoodEstimated Value: $1,434,800 - $1,746,000
5
Beds
3
Baths
2,597
Sq Ft
$623/Sq Ft
Est. Value
About This Home
This home is located at 3535 156th St, Flushing, NY 11354 and is currently estimated at $1,616,700, approximately $622 per square foot. 3535 156th St is a home located in Queens County with nearby schools including P.S. 32 - State Street, I.S. 25 Adrien Block, and Francis Lewis High School.
Ownership History
Date
Name
Owned For
Owner Type
Purchase Details
Closed on
Jul 23, 2018
Sold by
Lee Moung Suk and Lee Won Shick
Bought by
Hwang James and Luo Ting
Current Estimated Value
Home Financials for this Owner
Home Financials are based on the most recent Mortgage that was taken out on this home.
Original Mortgage
$788,000
Outstanding Balance
$680,051
Interest Rate
4.5%
Mortgage Type
Purchase Money Mortgage
Estimated Equity
$936,649
Purchase Details
Closed on
Oct 11, 2001
Sold by
Hu Bi-Jin and Chen Jian-Jian
Bought by
Lee Won Shick and Lee Moung Suk
Home Financials for this Owner
Home Financials are based on the most recent Mortgage that was taken out on this home.
Original Mortgage
$294,000
Interest Rate
6.66%
Mortgage Type
Purchase Money Mortgage
Purchase Details
Closed on
Apr 21, 1995
Sold by
Zhang Mei Li and Hu Bi Jin
Bought by
Hu Bi Jin and Chen Jian Jian
Create a Home Valuation Report for This Property
The Home Valuation Report is an in-depth analysis detailing your home's value as well as a comparison with similar homes in the area
Home Values in the Area
Average Home Value in this Area
Purchase History
| Date | Buyer | Sale Price | Title Company |
|---|---|---|---|
| Hwang James | $1,388,000 | -- | |
| Hwang James | $1,388,000 | -- | |
| Hwang James | $1,388,000 | -- | |
| Lee Won Shick | -- | -- | |
| Lee Won Shick | -- | -- | |
| Hu Bi Jin | -- | Chicago Title Insurance Co | |
| Hu Bi Jin | -- | Chicago Title Insurance Co |
Source: Public Records
Mortgage History
| Date | Status | Borrower | Loan Amount |
|---|---|---|---|
| Open | Hwang James | $788,000 | |
| Closed | Hwang James | $788,000 | |
| Previous Owner | Lee Won Shick | $294,000 |
Source: Public Records
Tax History
| Year | Tax Paid | Tax Assessment Tax Assessment Total Assessment is a certain percentage of the fair market value that is determined by local assessors to be the total taxable value of land and additions on the property. | Land | Improvement |
|---|---|---|---|---|
| 2025 | $12,744 | $63,452 | $17,445 | $46,007 |
| 2024 | $12,744 | $63,451 | $18,243 | $45,208 |
| 2023 | $12,469 | $62,082 | $15,531 | $46,551 |
| 2022 | $9,921 | $72,720 | $21,840 | $50,880 |
| 2021 | $9,857 | $73,560 | $21,840 | $51,720 |
| 2020 | $8,958 | $77,340 | $21,840 | $55,500 |
| 2019 | $8,830 | $66,240 | $21,840 | $44,400 |
| 2018 | $10,249 | $51,735 | $19,616 | $32,119 |
| 2017 | $9,793 | $49,509 | $18,352 | $31,157 |
| 2016 | $9,027 | $49,509 | $18,352 | $31,157 |
| 2015 | $5,414 | $44,064 | $19,308 | $24,756 |
| 2014 | $5,414 | $44,064 | $21,017 | $23,047 |
Source: Public Records
Map
Nearby Homes
- 35-35 155th St
- 3520 159th St
- 40-11 157th St
- 33-47 158th St
- 40-25 158th St
- 33-19 155th St
- 35-78 161st St
- 33-38 153rd St
- 3307 153rd St
- 155-17 Sanford Ave Unit E
- 155-17 Sanford Ave Unit 6D
- 155-17 Sanford Ave Unit 6A
- 155-17 Sanford Ave Unit 2F
- 35-91 161st St
- 35-91 161st St Unit 2B
- 32-24 157th St
- 3226 158th St
- 32-20 156th St
- 34-08 Murray Ln
- 3425 150th Place Unit 4D
Your Personal Tour Guide
Ask me questions while you tour the home.