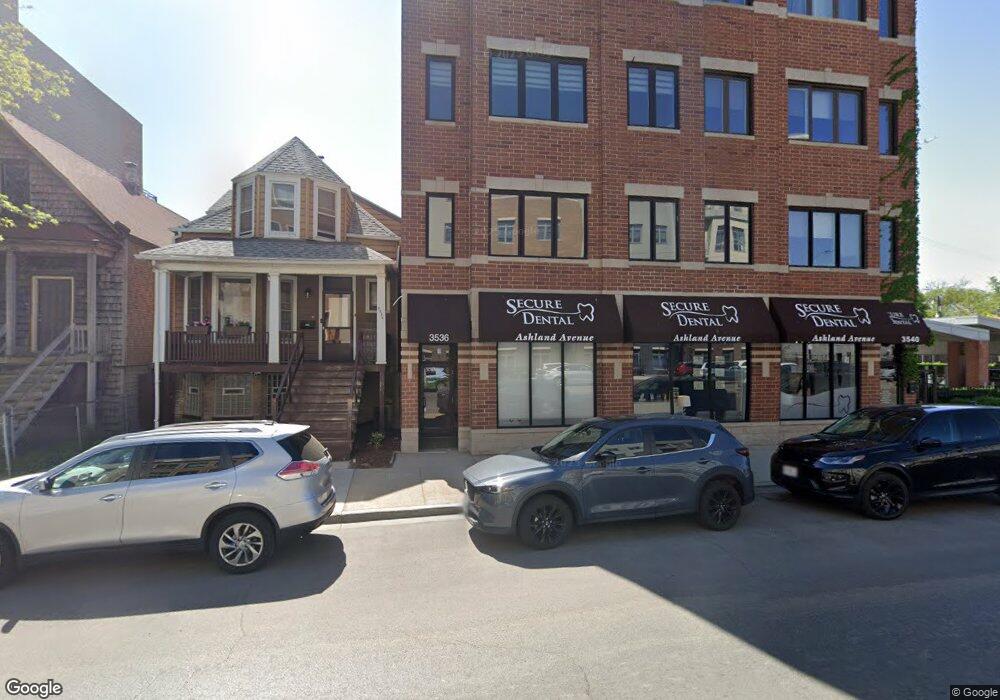
3536 N Ashland Ave Unit G4 Chicago, IL 60657
Southport Corridor NeighborhoodEstimated Value: $219,171 - $643,000
--
Bed
--
Bath
--
Sq Ft
5,489
Sq Ft Lot
About This Home
This home is located at 3536 N Ashland Ave Unit G4, Chicago, IL 60657 and is currently estimated at $436,543. 3536 N Ashland Ave Unit G4 is a home located in Cook County with nearby schools including Hamilton Elementary School, Lake View High School, and Saint Andrew School.
Ownership History
Date
Name
Owned For
Owner Type
Purchase Details
Closed on
Dec 30, 2024
Sold by
Pieper Robert E
Bought by
Tedrick Vincenzo and Cong Quoc H
Current Estimated Value
Home Financials for this Owner
Home Financials are based on the most recent Mortgage that was taken out on this home.
Original Mortgage
$250,000
Outstanding Balance
$248,154
Interest Rate
6.49%
Mortgage Type
New Conventional
Estimated Equity
$188,389
Purchase Details
Closed on
Jun 26, 2019
Sold by
Laystrom James W and Konishi Amy H
Bought by
Pieper Robert
Home Financials for this Owner
Home Financials are based on the most recent Mortgage that was taken out on this home.
Original Mortgage
$356,000
Interest Rate
4.12%
Mortgage Type
New Conventional
Purchase Details
Closed on
Nov 2, 2011
Sold by
Mb835 Llc
Bought by
Laystrom James William and Kanishi Amy Hisaye
Purchase Details
Closed on
Mar 24, 2011
Sold by
Mb Financial Bank Na
Bought by
Mb835 Llc
Create a Home Valuation Report for This Property
The Home Valuation Report is an in-depth analysis detailing your home's value as well as a comparison with similar homes in the area
Home Values in the Area
Average Home Value in this Area
Purchase History
| Date | Buyer | Sale Price | Title Company |
|---|---|---|---|
| Tedrick Vincenzo | $550,000 | Stewart Title Guaranty Company | |
| Pieper Robert | $445,000 | Baird & Warner Ttl Svcs Inc | |
| Laystrom James William | -- | None Available | |
| Mb835 Llc | -- | None Available |
Source: Public Records
Mortgage History
| Date | Status | Borrower | Loan Amount |
|---|---|---|---|
| Open | Tedrick Vincenzo | $250,000 | |
| Previous Owner | Pieper Robert | $356,000 |
Source: Public Records
Tax History Compared to Growth
Tax History
| Year | Tax Paid | Tax Assessment Tax Assessment Total Assessment is a certain percentage of the fair market value that is determined by local assessors to be the total taxable value of land and additions on the property. | Land | Improvement |
|---|---|---|---|---|
| 2024 | $1,504 | $7,515 | $1,860 | $5,655 |
| 2023 | $1,465 | $6,930 | $1,750 | $5,180 |
| 2022 | $1,465 | $6,930 | $1,750 | $5,180 |
| 2021 | $1,431 | $6,929 | $1,749 | $5,180 |
| 2020 | $1,424 | $6,225 | $671 | $5,554 |
| 2019 | $1,402 | $6,785 | $671 | $6,114 |
| 2018 | $1,379 | $6,785 | $671 | $6,114 |
| 2017 | $1,316 | $5,940 | $599 | $5,341 |
| 2016 | $1,227 | $5,940 | $599 | $5,341 |
| 2015 | $1,125 | $5,940 | $599 | $5,341 |
| 2014 | $1,064 | $5,535 | $425 | $5,110 |
| 2013 | $1,044 | $5,535 | $425 | $5,110 |
Source: Public Records
Map
Nearby Homes
- 3448 N Ashland Ave Unit 2S
- 1647 W Addison St Unit 1B
- 3507 N Bosworth Ave
- 3438 N Ashland Ave Unit 2N
- 3422 N Bosworth Ave Unit 1
- 3644 N Bosworth Ave
- 3639 N Greenview Ave
- 3509 N Janssen Ave
- 1753 W Cornelia Ave
- 3621 N Ravenswood Ave
- 3719 N Bosworth Ave
- 1443 W Waveland Ave Unit 1
- 1447 W Roscoe St Unit PH
- 1447 W Roscoe St Unit 1
- 1743 W Newport Ave
- 3434 N Southport Ave Unit 2
- 1541 W Henderson St Unit D
- 3539 N Southport Ave Unit 2N
- 3749 N Ashland Ave Unit 3S
- 3735 N Greenview Ave
- 3536 N Ashland Ave Unit G8
- 3536 N Ashland Ave Unit G7
- 3536 N Ashland Ave Unit G6
- 3536 N Ashland Ave Unit G5
- 3536 N Ashland Ave Unit G3
- 3536 N Ashland Ave Unit G2
- 3536 N Ashland Ave Unit G1
- 3536 N Ashland Ave Unit 4S
- 3536 N Ashland Ave Unit 4N
- 3536 N Ashland Ave Unit 3S
- 3536 N Ashland Ave Unit 2S
- 3534 N Ashland Ave
- 3540 N Ashland Ave
- 3532 N Ashland Ave
- 3530 N Ashland Ave Unit 2
- 3530 N Ashland Ave Unit 4
- 3530 N Ashland Ave Unit 1
- 3530 N Ashland Ave Unit 2
- 3530 N Ashland Ave
- 3528 N Ashland Ave Unit B