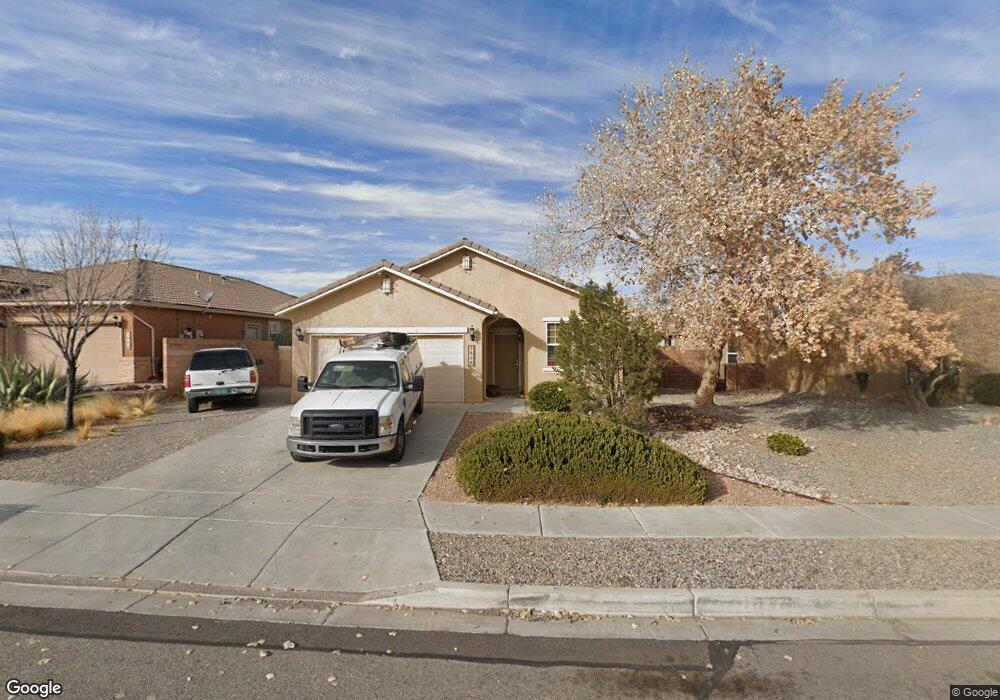
3536 N Pole Loop NE Rio Rancho, NM 87144
Enchanted Hills NeighborhoodEstimated Value: $362,000 - $365,000
3
Beds
2
Baths
1,603
Sq Ft
$226/Sq Ft
Est. Value
About This Home
This home is located at 3536 N Pole Loop NE, Rio Rancho, NM 87144 and is currently estimated at $363,000, approximately $226 per square foot. 3536 N Pole Loop NE is a home located in Sandoval County with nearby schools including Sandia Vista Elementary School, Mountain View Middle School, and Cleveland High School.
Ownership History
Date
Name
Owned For
Owner Type
Purchase Details
Closed on
Oct 28, 2020
Sold by
Rivera Shirley M
Bought by
Doyle David C and Espinoza Catherine A
Current Estimated Value
Home Financials for this Owner
Home Financials are based on the most recent Mortgage that was taken out on this home.
Original Mortgage
$164,318
Outstanding Balance
$146,220
Interest Rate
2.8%
Mortgage Type
Commercial
Estimated Equity
$216,780
Purchase Details
Closed on
Jul 16, 2020
Sold by
Rivera Salvador F and Rivera Shirley M
Bought by
Rivera Shirley M
Purchase Details
Closed on
Jul 19, 2007
Sold by
Pulte Homes Of New Mexico Inc
Bought by
Rivera Salvador F and Rivera Shirley M
Home Financials for this Owner
Home Financials are based on the most recent Mortgage that was taken out on this home.
Original Mortgage
$160,000
Interest Rate
6.54%
Mortgage Type
New Conventional
Create a Home Valuation Report for This Property
The Home Valuation Report is an in-depth analysis detailing your home's value as well as a comparison with similar homes in the area
Home Values in the Area
Average Home Value in this Area
Purchase History
| Date | Buyer | Sale Price | Title Company |
|---|---|---|---|
| Doyle David C | -- | None Listed On Document | |
| Rivera Shirley M | -- | None Available | |
| Rivera Salvador F | $212,800 | Fidelity National Title Insura |
Source: Public Records
Mortgage History
| Date | Status | Borrower | Loan Amount |
|---|---|---|---|
| Open | Doyle David C | $164,318 | |
| Previous Owner | Rivera Salvador F | $160,000 |
Source: Public Records
Tax History Compared to Growth
Tax History
| Year | Tax Paid | Tax Assessment Tax Assessment Total Assessment is a certain percentage of the fair market value that is determined by local assessors to be the total taxable value of land and additions on the property. | Land | Improvement |
|---|---|---|---|---|
| 2025 | $2,462 | $70,354 | $11,440 | $58,914 |
| 2024 | $2,424 | $68,306 | $10,748 | $57,558 |
| 2023 | $2,424 | $66,317 | $9,882 | $56,435 |
| 2022 | $2,353 | $64,385 | $9,000 | $55,385 |
| 2021 | $2,336 | $62,510 | $9,000 | $53,510 |
| 2020 | $2,268 | $60,689 | $0 | $0 |
| 2019 | $2,217 | $58,922 | $0 | $0 |
| 2018 | $2,024 | $57,206 | $0 | $0 |
| 2017 | $1,940 | $55,540 | $0 | $0 |
| 2016 | $2,110 | $53,922 | $0 | $0 |
| 2014 | $2,040 | $53,922 | $0 | $0 |
| 2013 | -- | $53,922 | $9,000 | $44,922 |
Source: Public Records
Map
Nearby Homes
- 7217 Skagway Dr NE
- 4229 N Pole Loop NE
- 7229 Skagway Dr NE
- 7109 Fairbanks Dr NE
- 7125 Napoleon Rd NE
- 7174 Wrangell Loop NE
- 7103 Wrangell Loop NE
- 3408 Demaveno Rd NE
- 3217 Nativitas Rd NE
- 3956 Kodiak Rd NE
- 5224 Bullseye Rd NE
- 5204 Bullseye Rd NE
- 6829 Cleary Loop NE
- 6817 Cleary Loop NE
- 5002 Scope Rd NE
- 7110 Overview Rd NE
- 6809 Japura Ct NE
- 4028 Windy Rd NE
- 6976 Dusty Dr NE
- 4341 Mountain Trail Loop NE
- 3532 N Pole Loop NE
- 3540 North Pole Loop NE
- 3528 N Pole Loop NE
- 3545 North Pole Loop NE
- 7105 Skagway Dr NE
- 3524 N Pole Loop NE
- 3537 N Pole Loop NE
- 3541 N Pole Loop NE
- 7101 Skagway Dr NE
- 3533 N Pole Loop NE
- 7109 Skagway Dr NE
- 3605 North Pole Loop NE
- 3613 North Pole Loop NE
- 3529 N Pole Loop NE
- 3549 North Pole Loop NE
- 3609 N Pole Loop NE
- 3520 N Pole Loop NE
- 3525 N Pole Loop NE
- 7113 Skagway Dr NE
- 3617 N Pole Loop NE