
Last list price
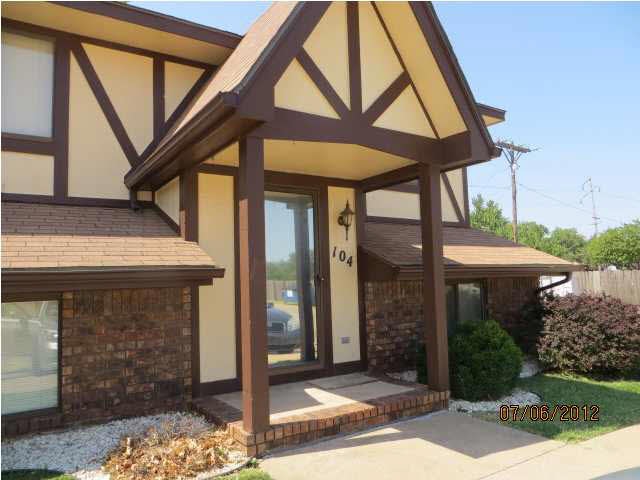
3536 W 2nd St N Wichita, KS 67203
Sunflower Neighborhood
2
Beds
--
Bath
1,020
Sq Ft
$110/mo
HOA Fee
Highlights
- Contemporary Architecture
- Walk-In Closet
- Combination Dining and Living Room
- Corner Lot
- Forced Air Heating and Cooling System
- Family Room
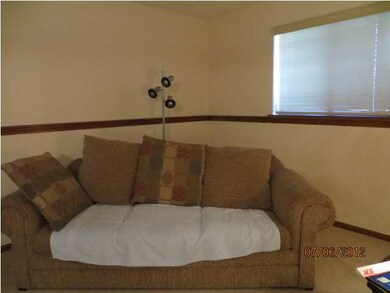
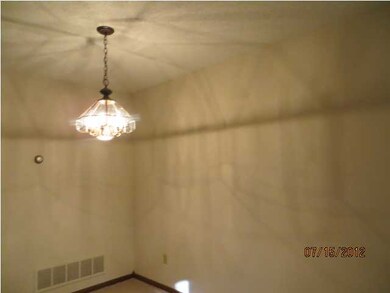
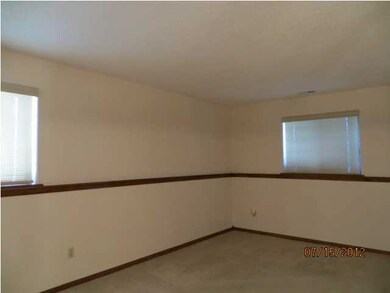
About This Home
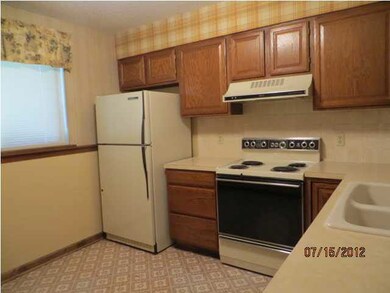
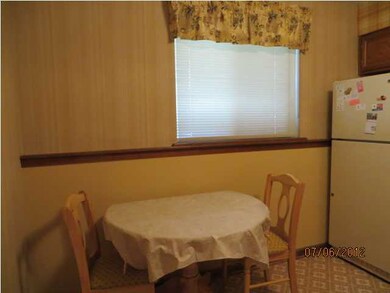
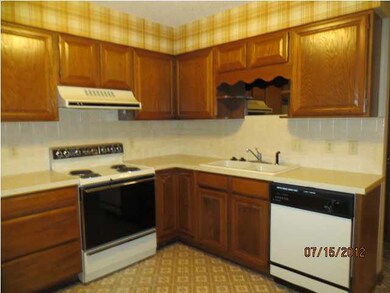
As of February 2025Immaculate, neutral carpet, great condo area and so affordable. Laundry is with half bath on lower level. Kitchen is fully applianced with view out windows. Large living room/dining area combo. Walk-in closet in one bedroom, two divided closets in the other. Hollywood bath in upper level connecting to bedroom. Small garage available at this time for $840 per year. Possession at closing.
Property Details
Home Type
- Condominium
Est. Annual Taxes
- $774
Year Built
- Built in 1982
HOA Fees
- $110 Monthly HOA Fees
Home Design
- Contemporary Architecture
- Bi-Level Home
- Frame Construction
- Composition Roof
Interior Spaces
- Window Treatments
- Family Room
- Combination Dining and Living Room
Kitchen
- Oven or Range
- Electric Cooktop
- Range Hood
- Dishwasher
- Disposal
Bedrooms and Bathrooms
- 2 Bedrooms
- Walk-In Closet
Laundry
- Laundry on lower level
- 220 Volts In Laundry
Basement
- Basement Fills Entire Space Under The House
- Kitchen in Basement
- Finished Basement Bathroom
Schools
- Lawrence Elementary School
- Hadley Middle School
- West High School
Utilities
- Forced Air Heating and Cooling System
- Heating System Uses Gas
Community Details
- Association fees include exterior maintenance, exterior insurance, lawn service, snow removal, trash
- Built by PANKRATZ
- Twin Oaks Subdivision
Ownership History
Date
Name
Owned For
Owner Type
Purchase Details
Closed on
Feb 15, 2000
Sold by
Storie Alice H
Bought by
Totten Patricia K
Home Financials for this Owner
Home Financials are based on the most recent Mortgage that was taken out on this home.
Original Mortgage
$73,520
Outstanding Balance
$25,436
Interest Rate
8.16%
Estimated Equity
$104,875
Similar Home in Wichita, KS
Create a Home Valuation Report for This Property
The Home Valuation Report is an in-depth analysis detailing your home's value as well as a comparison with similar homes in the area
Home Values in the Area
Average Home Value in this Area
Purchase History
| Date | Type | Sale Price | Title Company |
|---|---|---|---|
| Warranty Deed | -- | Security Abstract & Title Co |
Source: Public Records
Mortgage History
| Date | Status | Loan Amount | Loan Type |
|---|---|---|---|
| Open | $73,520 | No Value Available |
Source: Public Records
Property History
| Date | Event | Price | Change | Sq Ft Price |
|---|---|---|---|---|
| 05/06/2025 05/06/25 | Price Changed | $121,500 | -0.8% | $119 / Sq Ft |
| 04/21/2025 04/21/25 | Price Changed | $122,500 | -2.0% | $120 / Sq Ft |
| 04/01/2025 04/01/25 | For Sale | $125,000 | 0.0% | $123 / Sq Ft |
| 02/11/2025 02/11/25 | Sold | -- | -- | -- |
| 01/23/2025 01/23/25 | Pending | -- | -- | -- |
| 01/17/2025 01/17/25 | Price Changed | $125,000 | -3.5% | $96 / Sq Ft |
| 01/08/2025 01/08/25 | For Sale | $129,500 | +7.9% | $99 / Sq Ft |
| 11/15/2024 11/15/24 | Sold | -- | -- | -- |
| 10/31/2024 10/31/24 | Sold | -- | -- | -- |
| 10/22/2024 10/22/24 | Pending | -- | -- | -- |
| 10/10/2024 10/10/24 | For Sale | $120,000 | -3.9% | $118 / Sq Ft |
| 09/16/2024 09/16/24 | Pending | -- | -- | -- |
| 07/30/2024 07/30/24 | Sold | -- | -- | -- |
| 07/12/2024 07/12/24 | For Sale | $124,900 | +8.6% | $122 / Sq Ft |
| 07/03/2024 07/03/24 | Sold | -- | -- | -- |
| 07/02/2024 07/02/24 | Pending | -- | -- | -- |
| 06/27/2024 06/27/24 | For Sale | $115,000 | 0.0% | $113 / Sq Ft |
| 06/03/2024 06/03/24 | Pending | -- | -- | -- |
| 05/28/2024 05/28/24 | Pending | -- | -- | -- |
| 05/11/2024 05/11/24 | For Sale | $115,000 | -4.2% | $113 / Sq Ft |
| 04/18/2024 04/18/24 | Price Changed | $120,000 | -10.1% | $85 / Sq Ft |
| 04/10/2024 04/10/24 | For Sale | $133,500 | +16.2% | $94 / Sq Ft |
| 11/10/2022 11/10/22 | Sold | -- | -- | -- |
| 10/12/2022 10/12/22 | Pending | -- | -- | -- |
| 10/01/2022 10/01/22 | For Sale | $114,900 | -11.6% | $113 / Sq Ft |
| 05/11/2022 05/11/22 | Sold | -- | -- | -- |
| 04/09/2022 04/09/22 | Pending | -- | -- | -- |
| 04/06/2022 04/06/22 | For Sale | $130,000 | +52.9% | $92 / Sq Ft |
| 04/04/2022 04/04/22 | Sold | -- | -- | -- |
| 02/22/2022 02/22/22 | Pending | -- | -- | -- |
| 02/18/2022 02/18/22 | For Sale | $85,000 | +6.3% | $83 / Sq Ft |
| 11/22/2021 11/22/21 | Sold | -- | -- | -- |
| 11/05/2021 11/05/21 | Pending | -- | -- | -- |
| 11/01/2021 11/01/21 | For Sale | $80,000 | -33.3% | $78 / Sq Ft |
| 02/25/2021 02/25/21 | Sold | -- | -- | -- |
| 01/23/2021 01/23/21 | Pending | -- | -- | -- |
| 01/18/2021 01/18/21 | For Sale | $120,000 | +50.2% | $83 / Sq Ft |
| 09/02/2020 09/02/20 | Sold | -- | -- | -- |
| 07/25/2020 07/25/20 | Pending | -- | -- | -- |
| 07/24/2020 07/24/20 | For Sale | $79,900 | -33.4% | $78 / Sq Ft |
| 12/27/2019 12/27/19 | Sold | -- | -- | -- |
| 11/14/2019 11/14/19 | Pending | -- | -- | -- |
| 10/29/2019 10/29/19 | For Sale | $119,900 | +53.7% | $75 / Sq Ft |
| 08/18/2017 08/18/17 | Sold | -- | -- | -- |
| 08/14/2017 08/14/17 | Pending | -- | -- | -- |
| 03/14/2017 03/14/17 | For Sale | $78,000 | -21.2% | $48 / Sq Ft |
| 11/16/2016 11/16/16 | Sold | -- | -- | -- |
| 11/10/2016 11/10/16 | Sold | -- | -- | -- |
| 10/22/2016 10/22/16 | Pending | -- | -- | -- |
| 10/06/2016 10/06/16 | Pending | -- | -- | -- |
| 09/26/2016 09/26/16 | For Sale | $99,000 | +65.3% | $68 / Sq Ft |
| 04/26/2016 04/26/16 | For Sale | $59,900 | -40.0% | $59 / Sq Ft |
| 04/25/2016 04/25/16 | Sold | -- | -- | -- |
| 03/20/2016 03/20/16 | Pending | -- | -- | -- |
| 02/10/2016 02/10/16 | For Sale | $99,900 | 0.0% | $62 / Sq Ft |
| 02/01/2016 02/01/16 | Sold | -- | -- | -- |
| 01/12/2016 01/12/16 | Pending | -- | -- | -- |
| 11/09/2015 11/09/15 | For Sale | $99,900 | +25.0% | $64 / Sq Ft |
| 04/15/2015 04/15/15 | Sold | -- | -- | -- |
| 03/15/2015 03/15/15 | Pending | -- | -- | -- |
| 07/18/2014 07/18/14 | For Sale | $79,900 | -20.0% | $56 / Sq Ft |
| 11/14/2013 11/14/13 | Sold | -- | -- | -- |
| 10/13/2013 10/13/13 | Pending | -- | -- | -- |
| 09/23/2013 09/23/13 | For Sale | $99,900 | +42.7% | $61 / Sq Ft |
| 03/29/2013 03/29/13 | Sold | -- | -- | -- |
| 02/23/2013 02/23/13 | Pending | -- | -- | -- |
| 07/16/2012 07/16/12 | For Sale | $70,000 | -- | $69 / Sq Ft |
Source: South Central Kansas MLS
Tax History Compared to Growth
Tax History
| Year | Tax Paid | Tax Assessment Tax Assessment Total Assessment is a certain percentage of the fair market value that is determined by local assessors to be the total taxable value of land and additions on the property. | Land | Improvement |
|---|---|---|---|---|
| 2025 | $1,325 | $15,537 | $2,243 | $13,294 |
| 2023 | $1,325 | $13,042 | $1,346 | $11,696 |
| 2022 | $1,234 | $11,443 | $1,265 | $10,178 |
| 2021 | $1,216 | $10,799 | $1,265 | $9,534 |
| 2020 | $1,185 | $10,488 | $1,265 | $9,223 |
| 2019 | $1,140 | $10,086 | $1,265 | $8,821 |
| 2018 | $1,096 | $9,695 | $1,495 | $8,200 |
| 2017 | $1,170 | $0 | $0 | $0 |
| 2016 | $1,121 | $0 | $0 | $0 |
| 2015 | -- | $0 | $0 | $0 |
| 2014 | -- | $0 | $0 | $0 |
Source: Public Records
Agents Affiliated with this Home
-
Terry Ziegler
Seller's Agent in 2025
Terry Ziegler
Reece Nichols South Central Kansas
(316) 650-2140
95 Total Sales
-
Cari Palesano
Seller's Agent in 2025
Cari Palesano
Berkshire Hathaway PenFed Realty
(316) 992-7753
1 in this area
26 Total Sales
-
Janelle Moore
Seller's Agent in 2024
Janelle Moore
Platinum Realty LLC
(316) 312-9179
1 in this area
25 Total Sales
-
Ali Hayden
Seller's Agent in 2024
Ali Hayden
LPT Realty, LLC
(800) 268-8117
2 in this area
65 Total Sales
-
Lisa Nagabhushan
L
Seller's Agent in 2024
Lisa Nagabhushan
Berkshire Hathaway PenFed Realty
(316) 631-5994
3 in this area
76 Total Sales
-
DANIELLE WILDEMAN
Seller's Agent in 2024
DANIELLE WILDEMAN
Reece Nichols South Central Kansas
(316) 641-1212
3 in this area
114 Total Sales
Map
Source: South Central Kansas MLS
MLS Number: 340011
APN: 136-24-0-23-02-014.01
Disclaimer: Certain information contained herein is derived from information provided by parties other than Homes.com. All information provided is deemed reliable, but is not guaranteed to be accurate and should be independently verified.
![]() IDX information is provided exclusively for personal, non-commercial use, and may not be used for any purpose other than to identify prospective properties consumers may be interested in purchasing. This information is not verified for authenticity or accuracy, is not guaranteed and may not reflect all real estate activity in the market. © 1993-2025 South Central Kansas Multiple Listing Service, Inc. All rights reserved.
IDX information is provided exclusively for personal, non-commercial use, and may not be used for any purpose other than to identify prospective properties consumers may be interested in purchasing. This information is not verified for authenticity or accuracy, is not guaranteed and may not reflect all real estate activity in the market. © 1993-2025 South Central Kansas Multiple Listing Service, Inc. All rights reserved.
Nearby Homes
- 123 N Kessler St
- 111 N Kessler St
- 3636 W Douglas Ave
- 4102 W Douglas Ave
- 118 N Florence St
- 145 N Sabin St
- 121 S Saint Paul St
- 132 S Young St
- 757 N Joann St
- 421 N Edwards Ave
- 137 N Richmond Ave
- 2929 W Elm St
- 119 Richmond N
- 602 N Richmond Ave
- 767 N Dougherty Ave
- 532 S Leonine Rd
- 2439 W 3rd St N
- 302 N Doris St
- 2416 W Burton St
- 229 S Sedgwick St